To examine the performance of the R 2500 R's DAC, I used the coaxial and optical S/PDIF inputs, both of which accepted data sampled at rates up to 192kHz, and USB data sourced from my MacBook Pro. The USB Prober utility identified the R 2500 R as "R 2500 R" from "T+A elektroakustik," with the serial number string "3932343130335107001D0027," and indicated that the USB port operated in the optimal isochronous asynchronous mode. Apple's AudioMIDI utility showed that the T+A accepted 24-bit integer data via USB sampled at all rates from 44.1kHz to 768kHz.
The T+A's digital inputs preserved absolute polarity from all the outputs. With the volume control set to the maximum and a 1kHz tone at –20dBFS, the output level was 1.59V at the headphone output and 539mV from the Preamplifier output. The R 2500 R's output level into 8 ohms at the speaker outputs with the same signal was 20.25V, which is just 4.7dB below the clipping voltage into that load. As is often the case with integrated amplifiers, the R 2500 R's DAC offers higher gain than is strictly necessary. To avoid overloading the output stage, I performed all subsequent digital input testing at the Preamplifier output with the speakers turned off.
Footnote 1: see fig.2 here and fig.3 in this issue's review of the Linear Tube Aero D/A processor.
Footnote 2: See fig.2 here and the second graph here.
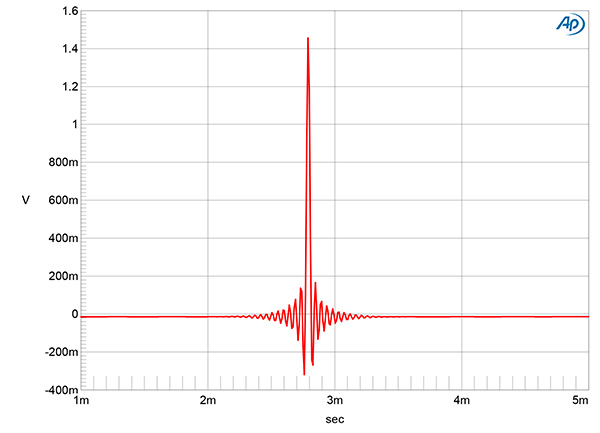
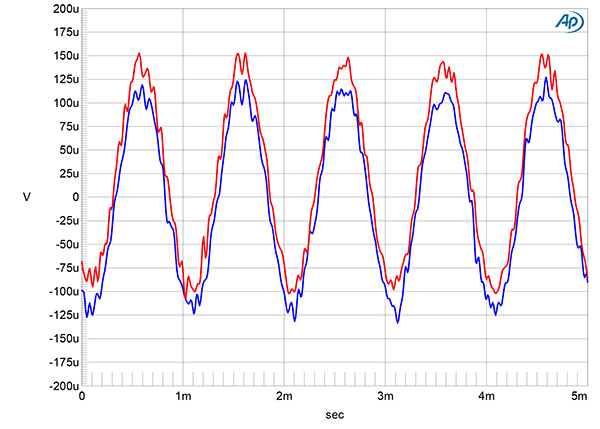
Fig.11 T+A R2500R, digital inputs, FIR Long filter, impulse response (one sample at 0dBFS, 44.1kHz sampling, 4ms time window).
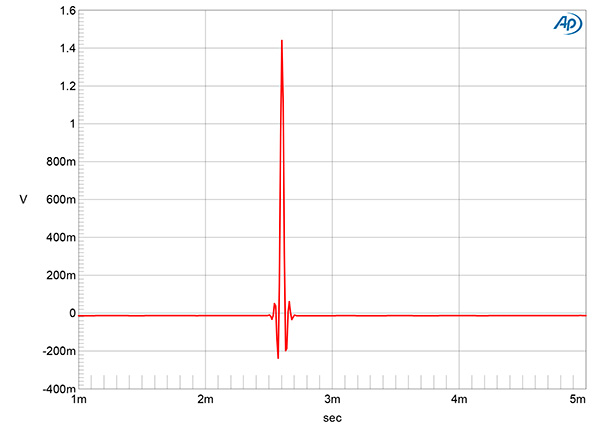
Fig.12 T+A R2500R, digital inputs, FIR Short filter, impulse response (one sample at 0dBFS, 44.1kHz sampling, 4ms time window).
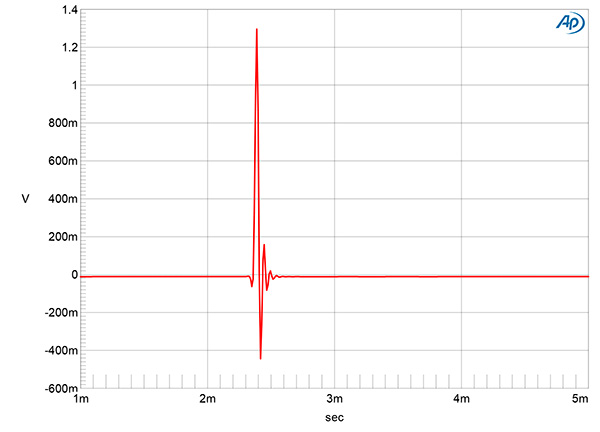
Fig.13 T+A R2500R, digital inputs, Bezier/IIR filter, impulse response (one sample at 0dBFS, 44.1kHz sampling, 4ms time window).
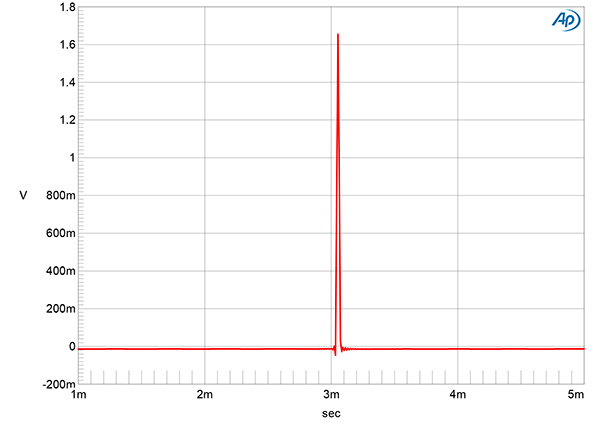
Fig.14 T+A R2500R, digital inputs, NOS modes, impulse response (one sample at 0dBFS, 44.1kHz sampling, 4ms time window).
The T+A R 2500 R's Settings menu offers a choice of four oversampling reconstruction filters for PCM data—FIR Long, FIR Short, Bezier/IIR, and Bezier—as well as two nonoversampling modes. (There is no reconstruction filter in these last two modes. The result is a stepped-output waveform (footnote 1). Fig.11 shows the FIR Long filter's impulse response with 44.1kHz S/ PDIF data. The filter is a long linear-phase type. The FIR Short impulse response (fig.12) indicates that this is a very short linear-phase filter. The Bezier filter impulse response was similar, but the Bezier/IIR filter's impulse (fig.13) was unusual in that it resembles the Short filter's response but with a small amount of ringing following the single high sample. The NOS modes' impulse responses were time-perfect, with no ringing (fig.14).
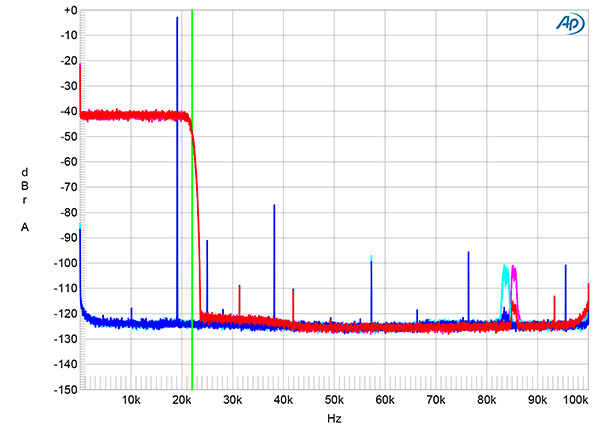
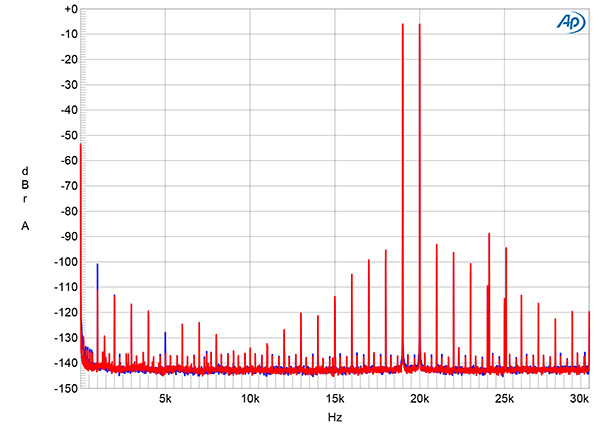
Fig.15 T+A R2500R, digital inputs, FIR Long filter, wideband spectrum of white noise at –4dBFS (left channel red, right magenta) and 19.1kHz tone at –3dBFS (left blue, right cyan) into 100k ohms with data sampled at 44.1kHz (20dB/vertical div.).
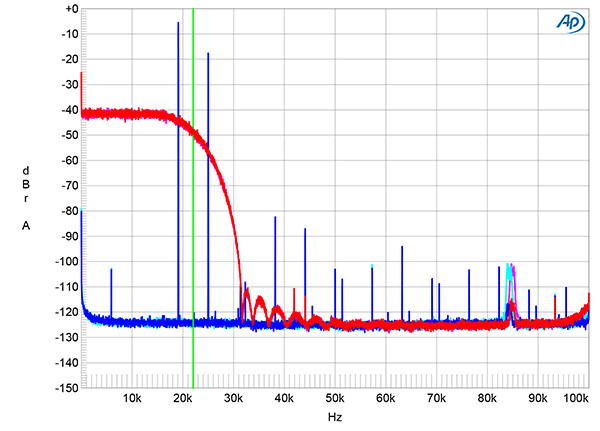
Fig.16 T+A R2500R, digital inputs, FIR Short filter, wideband spectrum of white noise at –4dBFS (left channel red, right magenta) and 19.1kHz tone at –3dBFS (left blue, right cyan) into 100k ohms with data sampled at 44.1kHz (20dB/vertical div.).
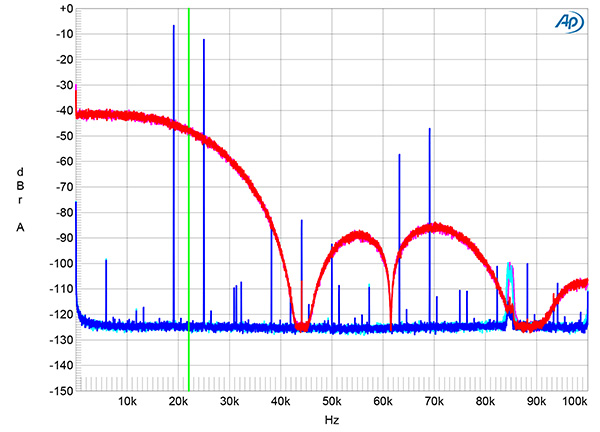
Fig.17 T+A R2500R, digital inputs, Bezier filter, wideband spectrum of white noise at –4dBFS (left channel red, right magenta) and 19.1kHz tone at –3dBFS (left blue, right cyan) into 100k ohms with data sampled at 44.1kHz (20dB/vertical div.).
The magenta and red traces in fig.15 show the FIR Long filter's ultrasonic rolloff with data sampled at 44.1kHz. They reach full stop-band attenuation just above half the sample rate (this indicated by the vertical green line), with the aliased image at 25kHz of a 19.1kHz tone at –3dBFS (cyan, blue) suppressed by 88dB. The harmonics associated with the 19.1kHz tone all lie at or below –74dB, with the second the highest in level. With the FIR short filter (fig.16), full stop-band attenuation isn't reached until 32kHz, with the aliased image at 25kHz suppressed by just 16dB. With the Bezier filter (fig.17), which TF told me he preferred, the rolloff above the audioband is much slower. As expected, the NOS modes had high-level images of the audioband white-noise spectrum centered on nulls at integer multiples of the sample rate (footnote 2).
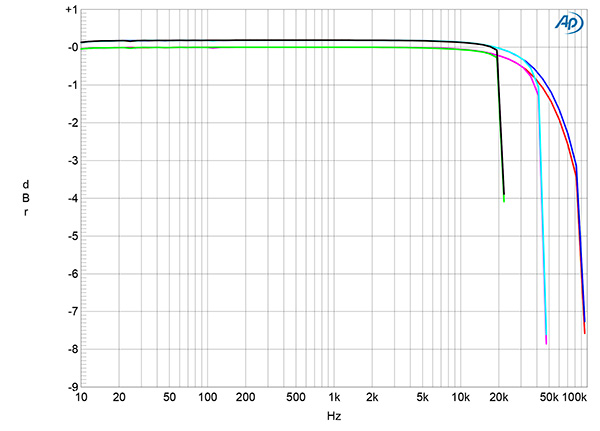
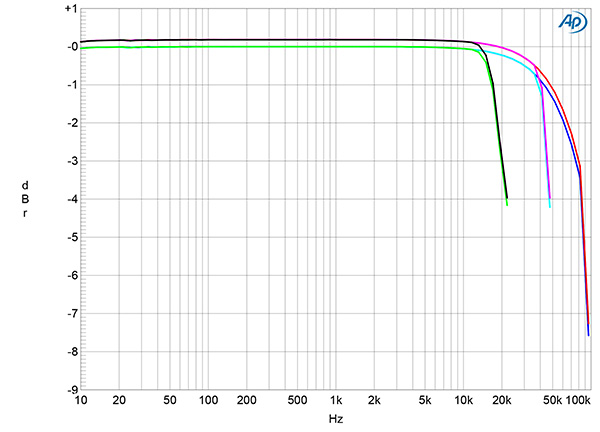
Fig.18 T+A R2500R, digital inputs, FIR Long filter, Wide bandwidth, frequency response at –12dBFS into 100k ohms with data sampled at: 44.1kHz (left channel green, right gray), 96kHz (left cyan, right magenta), and 192kHz (left blue, right red) (1dB/vertical div.).
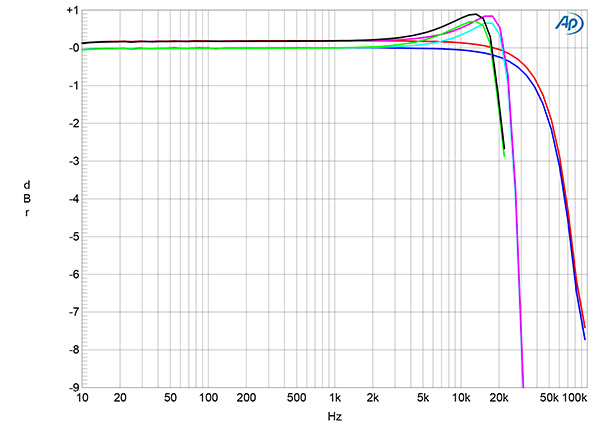
Fig.19 T+A R2500R, digital inputs, FIR Short filter, Wide bandwidth, frequency response at –12dBFS into 100k ohms with data sampled at: 44.1kHz (left channel green, right gray), 96kHz (left cyan, right magenta), and 192kHz (left blue, right red) (1dB/vertical div.).
Fig.20 T+A R2500R, digital inputs, Bezier/IIR filter, Wide bandwidth, frequency response at –12dBFS into 100k ohms with data sampled at: 44.1kHz (left channel green, right gray), 96kHz (left cyan, right magenta), and 192kHz (left blue, right red) (1dB/vertical div.).
The frequency response with data sampled at 44.1kHz, 96kHz, and 192kHz, the FIR Long filter, and the Bandwidth set to Wide, the audioband response is flat, with a gentle rolloff above 20kHz, interrupted by a sharp decline just below half of each sample rate (fig.18). With 192kHz data (blue and red traces), the Wide –3dB frequency was 80kHz; this dropped to 45kHz with the Narrow bandwidth setting. (With 44.1kHz data, the Normal setting reduced the level at 20kHz by just 0.25dB.) With the FIR Short and Bezier filters, the output with 44.1kHz data starts to roll off above 15kHz, reaching –3dB at 20kHz (fig.19). The Bezier/IIR filter's behavior was unusual, in that the response peaked by 1dB in the top audio octave with data sampled at 44.1kHz and 96kHz (fig.20).
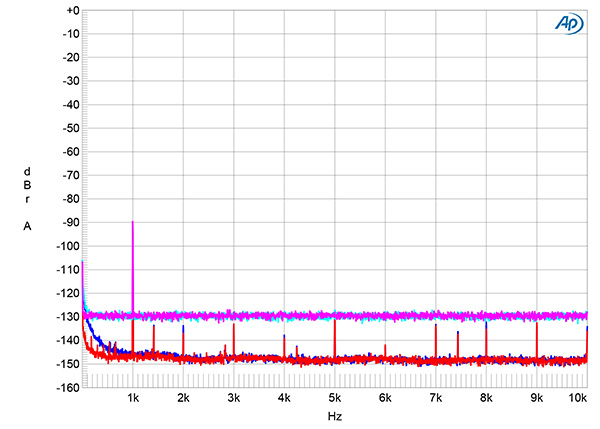
Fig.21 T+A R2500R, digital inputs, spectrum with noise and spuriae of dithered 1kHz tone at –90dBFS with: 16-bit data (left channel cyan, right magenta), 24-bit data (left blue, right red) (20dB/vertical div.).
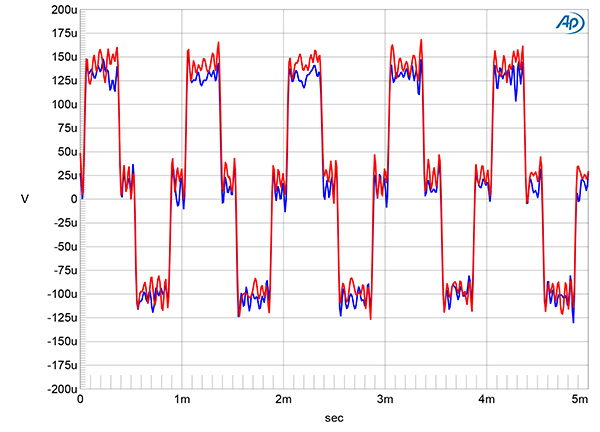
Fig.22 T+A R2500R, digital inputs, waveform of undithered 1kHz sinewave at –90.31dBFS, 16-bit data (left channel blue, right red).
Fig.23 T+A R2500R, digital inputs, waveform of undithered 1kHz sinewave at –90.31dBFS, 24-bit data (left channel blue, right red).
An increase in bit depth from 16 to 24, with dithered data representing a 1kHz tone at –90dBFS, dropped the R 2500 R's noisefloor by 19dB (fig.21). This implies a resolution close to 19 bits. When I played undithered data representing a tone at exactly –90.31dBFS, the waveform was symmetrical, with negligible DC offset, and the three DC voltage levels described by the data were clearly defined (fig.22). With undithered 24-bit data (fig.23), the R 2500 R output a relatively clean sinewave.
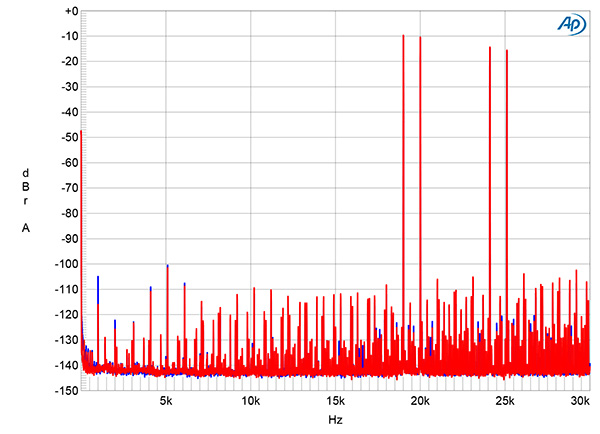
Fig.24 T+A R2500R, digital inputs, FIR Long filter, 24-bit data, HF intermodulation spectrum, DC–30kHz, 19+20kHz at 0dBFS, 44.1kHz data (left channel blue, right red; linear frequency scale).
Fig.25 T+A R2500R, digital inputs, Bezier filter, 24-bit data, HF intermodulation spectrum, DC–30kHz, 19+20kHz at 0dBFS, 44.1kHz data (left channel blue, right red; linear frequency scale).
As it had with the analog inputs, the T+A's digital inputs produced very low levels of harmonic and intermodulation distortion. Fig.24 shows the output spectrum with an equal mix of 19 and 20kHz tones, each at –6dBFS, with the FIR Long filter. The second-order intermodulation product at 1kHz lies at –100dB (0.001%), with the higher-order products all lying below –94dB. As expected from fig.16, the aliased images of the primary tones with the FIR Short filter were suppressed by only 10dB and were even higher in level with the Bezier filter (fig.25), which also introduced low-level aliased content in the audioband.
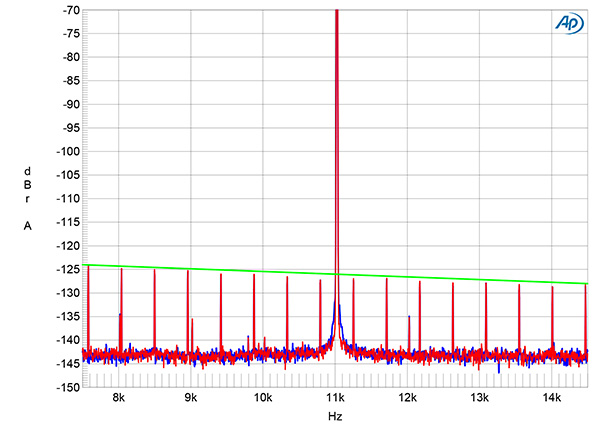
Fig.26 T+A R2500R, Toslink input, high-resolution jitter spectrum of analog output signal, 11.025kHz at –6dBFS, sampled at 44.1kHz with LSB toggled at 229Hz: 16-bit data (left channel blue, right red). Center frequency of trace, 11.025kHz; frequency range, ±3.5kHz.
Fig.26 shows the spectrum of the R 2500 R's output when it was fed high-level 16-bit J-Test data via TosLink. The odd-order harmonics of the undithered low-frequency, LSB-level squarewave lie very close to the correct levels, and the central spike that represents the high-level tone at one-quarter the sample rate (Fs/4) is extremely narrow. Repeating this analysis with CD data gave an identical result.
I tested the T+A R 2500 R's behavior as a CD player using the Pierre Verany Test CD and a CD-R with test tone files. The R 2500 R successfully played the tracks on the Pierre Verany CD with gaps in the data spiral up to 1.25mm in length, but there were audible glitches when a single gap was 1.5mm long and with two closely spaced 1.5mm gaps. As the Compact Disc standard, the so-called Red Book, requires only that a player cope with gaps of up to 0.2mm in length, the T+A's error correction is superb.
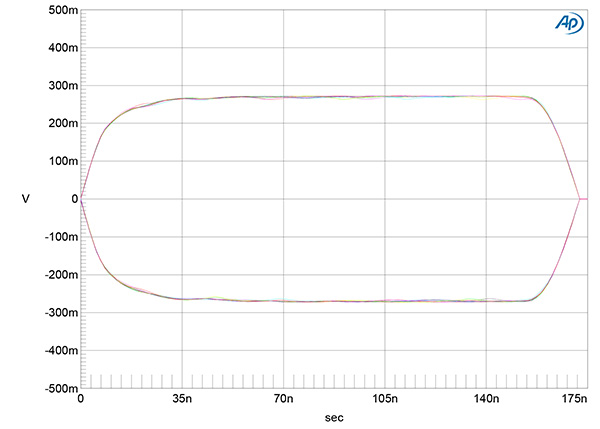
Fig.27 T+A R2500R, 16-bit, 44.1kHz, J-Test data, eye pattern of digital output, (±2.5V vertical scale, 175ns horizontal scale).
Playing 16-bit Miller/Dunn J-Test data on a CD-R, the eye pattern from the amplifier's coaxial digital output was wide open (fig.27), and the jitter level was just 389.2ps. Something peculiar happened when I subsequently tried to repeat this test. The T+A's front panel identified the CD-R as "Tango One" from "Stephen Leather" and the disc wouldn't play. All I can assume is that the R 2500 R used the network connection to misidentify the disc.
Overall, the T+A R 2500 R's measured performance demonstrates excellent audio engineering with both analog and digital input signals.—John Atkinson
Footnote 1: see fig.2 here and fig.3 in this issue's review of the Linear Tube Aero D/A processor.


