Sidebar 3: Measurements
I measured the Sonnet Morpheus with my Audio Precision SYS2722 system (see the January 2008 "As We See It"), repeating some tests with the magazine's Audio Precision APx555 system. The AES3 and coaxial S/PDIF inputs accepted 16- and 24-bit data sampled at rates up to 192kHz; the optical TosLink input accepted data sampled up to 96kHz. I wasn't able to examine the Morpheus's performance via its USB input because this was fitted with a RJ45 jack, presumably for an I2S connection from Sonnet's Hermes network bridge, which I didn't have at hand for the measurements.
Although the Morpheus has a volume control, I set the processor to Fixed Volume for the measurements, which is how I understood AH had auditioned it. The Morpheus's maximum output level at 1kHz was 4.21V from the balanced outputs, 2.12V from the single-ended outputs. Both outputs preserved absolute polarity (ie, were noninverting). The single-ended output impedance was a low 99 ohms at all audio frequencies, the balanced output impedance 98 ohms at 20Hz and 1kHz, dropping slightly to 92 ohms at 20kHz.
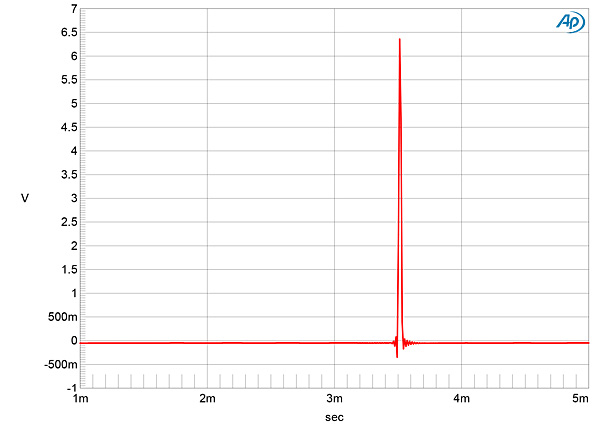
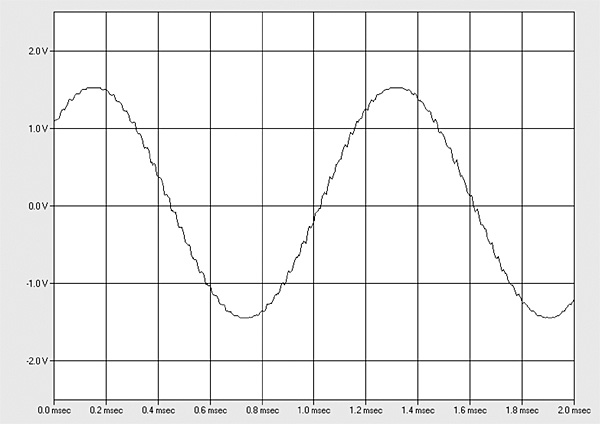
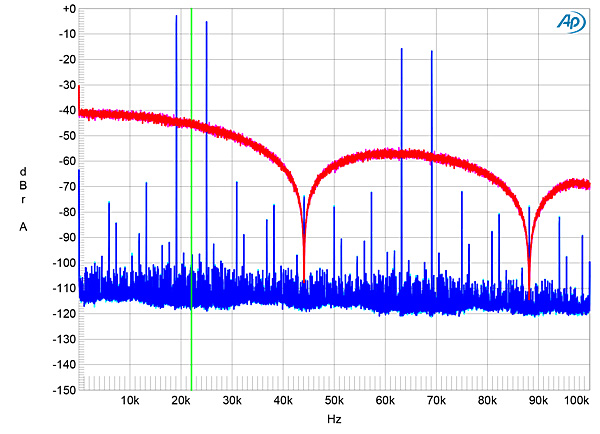
The Sonnet is a nonoversampling design that lacks a reconstruction filter. The impulse response is therefore transient-perfect (fig.1; ignore the small amount of pre- and post-ringing in this graph, which is due to the Audio Precision's anti-aliasing filter, operating at a sample rate of 200kHz). The trade-off for this optimized time-domain behavior is a discontinuous output waveform (fig.2) and an extremely slow ultrasonic rolloff, with nulls at the sample frequency and its harmonics (fig.3, magenta and red traces). The lack of a reconstruction filter also means that there is very little attenuation of aliased images (footnote 1). The aliased image at 25kHz of a full-scale tone at 19.1kHz (cyan, blue) is hardly suppressed at all, and many other images are visible in this graph. The harmonics associated with the 19.1kHz tone are all very low in level, however.
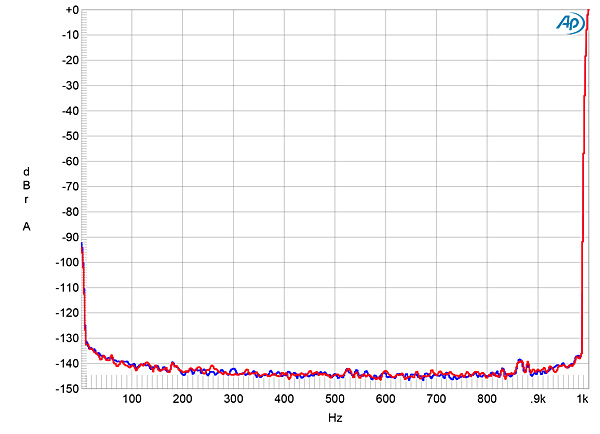
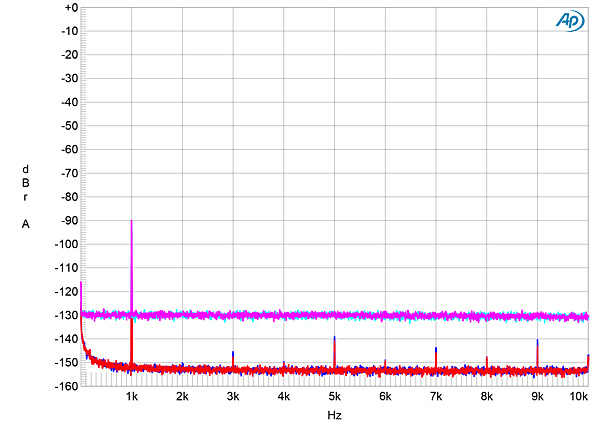
 The Morpheus produced very low levels of harmonic distortion with full-scale data (fig.11). The third and fifth harmonics are the highest in level, at just –110dB (0.0003%), and though other harmonics are visible in this graph, these are all 10–20dB lower in level. This spectrum was taken into the high 100k ohms load. The levels of the harmonics didn't rise when I reduced the load impedance to the stressful 600 ohms. Intermodulation distortion with an equal mix of 19 and 20kHz tones, each lying at –6dBFS, was low, with the difference tone at 1kHz lying at –84dB (0.006%, fig.12). However, the test tones generated many aliased products, both in the audioband and above half the sample rate. Reducing the signal level by 3dB didn't alter the picture (not shown).
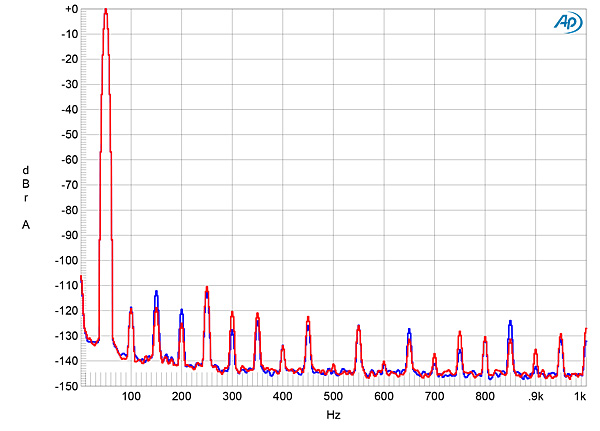
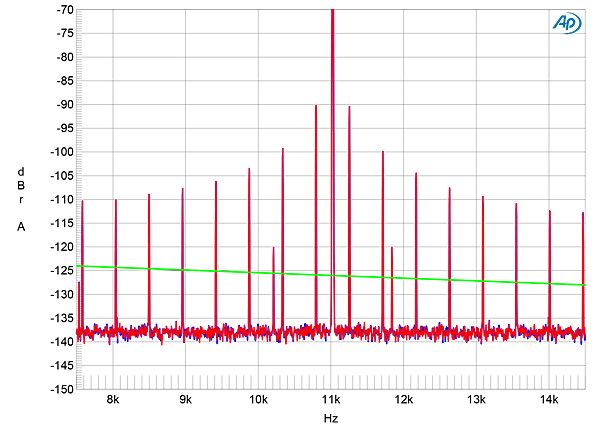
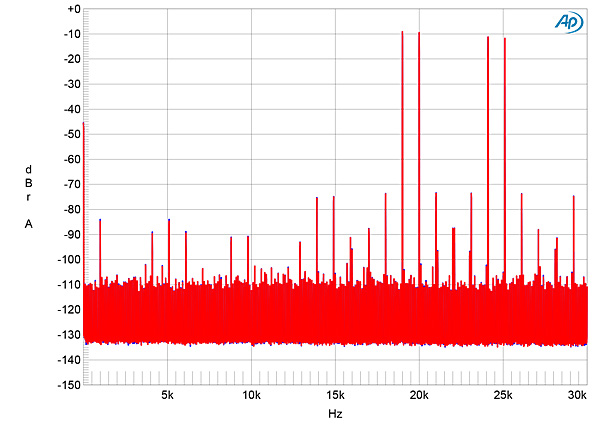 Fig.13 shows the spectrum of the Morpheus's output when its TosLink was fed high-level, 16-bit J-Test data. All the odd-order harmonics of the undithered low-frequency, LSB-level squarewave lie well above the correct levels, these indicated by the sloping green line. A pair of sidebands of unknown origin is also present at ±817Hz. I repeated this test with 24-bit J-Test data and with AES3 data but got the same result.
Footnote 1: See my discussion of why a reconstruction filter is necessary here.
Fig.1 Sonnet Morpheus, impulse response (one sample at 0dBFS, 44.1kHz sampling, 4ms time window).
Fig.2 Sonnet Morpheus, waveform of 1kHz tone (2ms time window).
Fig.3 Sonnet Morpheus, wideband spectrum of white noise at –4dBFS (left channel red, right magenta) and 19.1kHz tone at 0dBFS (left blue, right cyan) into 100k ohms with data sampled at 44.1kHz (20dB/vertical div.).
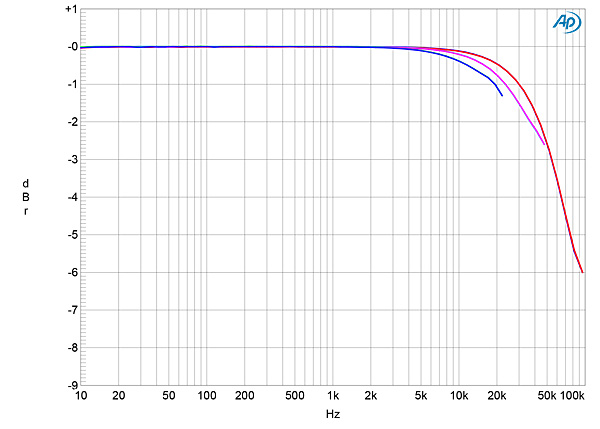
Fig.4 shows the frequency response with data sampled at 44.1, 96, and 192kHz. The output is down by 1dB at the top of the audioband with 44.1kHz data (blue and green traces). There is a smooth ultrasonic rolloff with 96kHz data (cyan, magenta traces) and 192kHz data (gray, red traces). Channel separation was superb, at >125dB in both directions below 1kHz (fig.5), decreasing to a still-superb 113dB at 20kHz. The Morpheus's noisefloor was free from any power supply–related spuriae (fig.6).
Fig.4 Sonnet Morpheus, frequency response at –12dBFS into 100k ohms with data sampled at: 44.1kHz (left channel green, right blue), 96kHz (left cyan, right magenta), and 192kHz (left gray, right red) (1dB/vertical div.).
Fig.5 Sonnet Morpheus, channel separation (5dB/vertical div.).
Fig.6 Sonnet Morpheus, spectrum with noise and spuriae of dithered 1kHz tone at 0dBFS with 24-bit data (left channel blue, right red) (20dB/vertical div.).
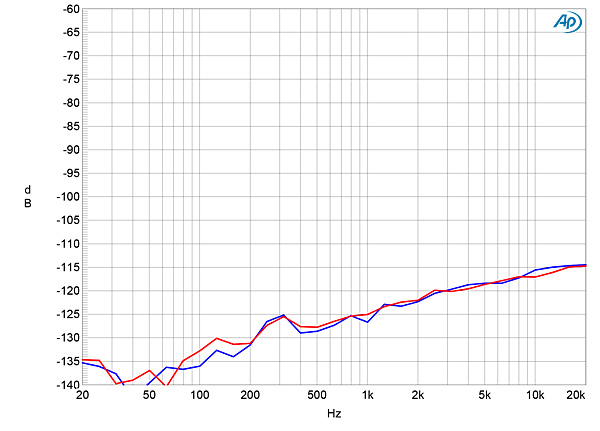
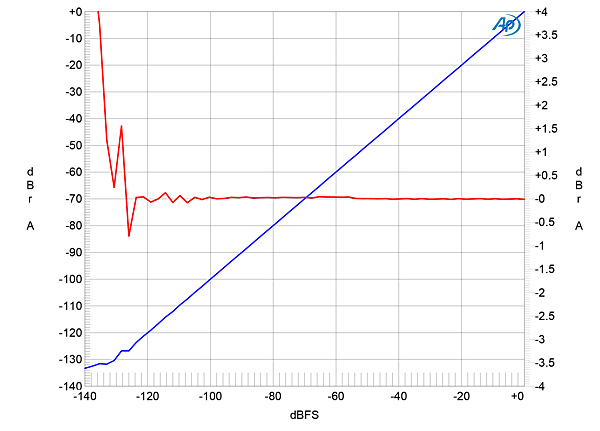
Linearity error with 24-bit data (fig.7) was negligible down to –120dBFS, which implies high resolution. An increase in bit depth from 16 to 24, with dithered data representing a 1kHz tone at –90dBFS, dropped the Sonnet's noisefloor by around 24dB (fig.8). This implies a resolution of 20 bits, which is excellent. When I played undithered data representing a tone at exactly –90.31dBFS, the waveform was symmetrical, with negligible DC offset, and the three DC voltage levels described by the data were free from noise (fig.9). With undithered 24-bit data (fig.10), the Morpheus's very low analog noisefloor means it can output a clean sinewave, even at this very low signal level.
Fig.7 Sonnet Morpheus, left channel, 1kHz output level vs data level in dBFS (blue, 20dB/vertical div., left); linearity error (red, 1dB/vertical div., right).
Fig.8 Sonnet Morpheus, spectrum with noise and spuriae of dithered 1kHz tone at –90dBFS with: 16-bit data (left channel cyan, right magenta), 24-bit data (left blue, right red) (20dB/vertical div.).
Fig.9 Sonnet Morpheus, waveform of undithered 1kHz sinewave at –90.31dBFS, 16-bit data (left channel blue, right red).
Fig.10 Sonnet Morpheus, waveform of undithered 1kHz sinewave at –90.31dBFS, 24-bit data (left channel blue, right red).
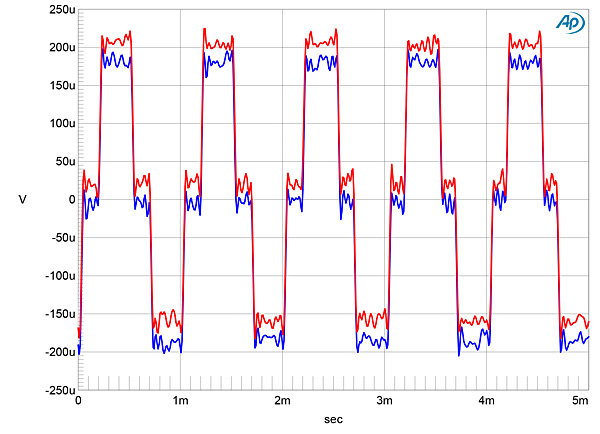
Fig.11 Sonnet Morpheus, 24-bit data, spectrum of 50Hz sinewave, DC–1kHz, at 0dBFS into 100k ohms (left channel blue, right red; linear frequency scale).
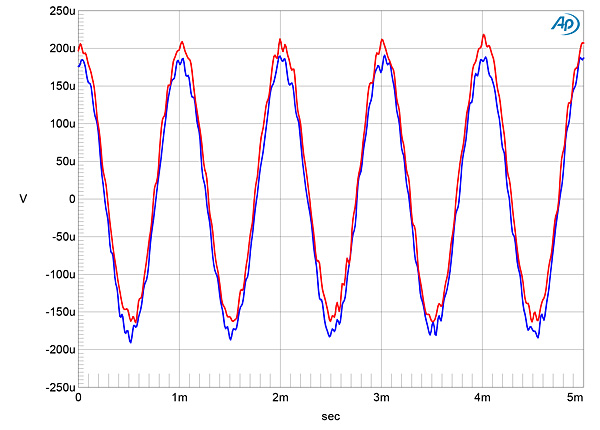
Fig.12 Sonnet Morpheus, HF intermodulation spectrum, DC–30kHz, 19+20kHz at 0dBFS into 100k ohms, 24-bit, 44.1kHz data (left channel blue, right red; linear frequency scale).
Fig.13 Sonnet Morpheus, high-resolution jitter spectrum of analog output signal, 11.025kHz at –6dBFS, sampled at 44.1kHz with LSB toggled at 229Hz: 16-bit TosLink data (left channel blue, right red). Center frequency of trace, 11.025kHz; frequency range, ±3.5kHz.
Some of the Sonnet Morpheus's measured performance—the optimal time-domain behavior, against which must be set the production of high-level aliased images—is the inevitable result of the decision not to use a reconstruction filter. The Morpheus does offer excellent resolution, a very low noisefloor, and superb channel separation, but its disappointing rejection of word-clock jitter via its AES3 and S/PDIF inputs suggests something is not right with the receiver used for these inputs. It is possible, however, that the USB and I2S inputs, which bypass the receiver, don't suffer from this problem.—John Atkinson
Footnote 1: See my discussion of why a reconstruction filter is necessary here.


