Sidebar 3: Measurements
I performed a full set of measurements on the T+A R 2500 R using my Audio Precision SYS2722 system. Although the R 2500 R's Menu can be accessed with the front-panel and the remote control buttons, I found it easier to use the T+A MusicNavigator G3 app, which I installed on my iPad mini after connecting the amplifier's Ethernet port to my network. (Not all the settings are available with the app.) The amplifier is specified as having a maximum output power of 140Wpc into 8 ohms; I preconditioned the R 2500 R before the measurements by following the CEA's recommendation, running it at one-eighth that power into 8 ohms for 30 minutes. Following that period, the temperature of the top panel was 90.4°F (32.4°C), though that of the internal, fan-cooled power amplifier module was much higher, at 134.6° (57.0°C).
Looking first at the R 2500 R's line inputs, the amplifier preserved absolute polarity at all of its outputs with both balanced and unbalanced input signals. The volume control operated in accurate 1dB steps, and with the volume control set to its maximum of "85," the voltage gain at 1kHz from the loudspeaker outputs into 8 ohms was 33.14dB with the balanced input and 38.85dB with the unbalanced input, 1.46dB and 7.35dB, respectively, from the Preamplifier outputs, and 11.04dB from the headphone output. T+A specifies the balanced input impedance as 5k ohms. I measured 5.2k ohms across the audioband. The unbalanced input impedance, specified as 20k ohms, was 41k ohms at 20Hz and 1kHz, 32k ohms at 20kHz.
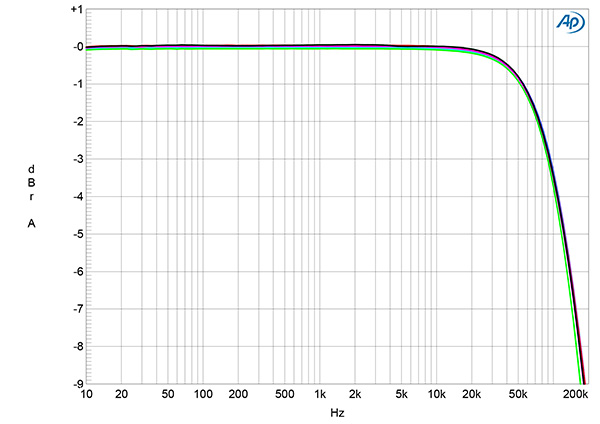
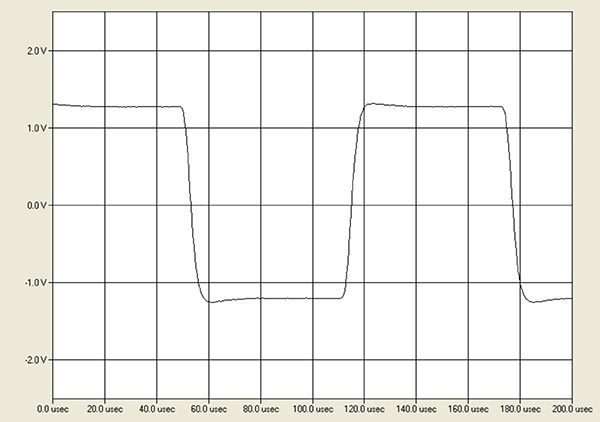
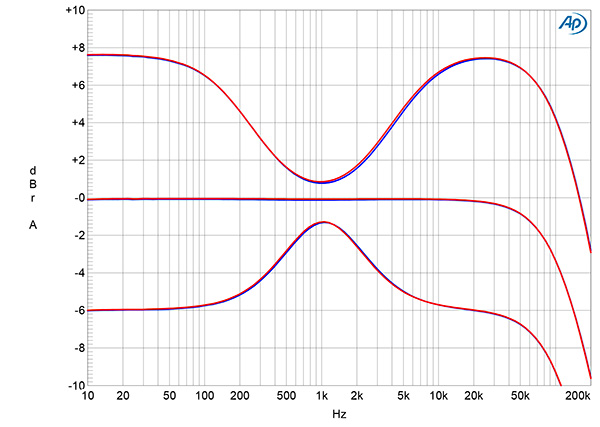
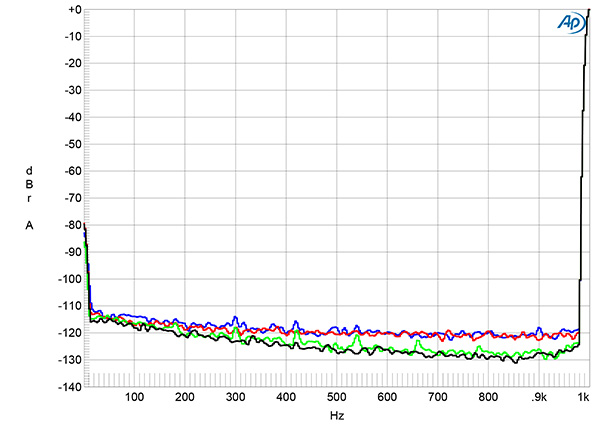
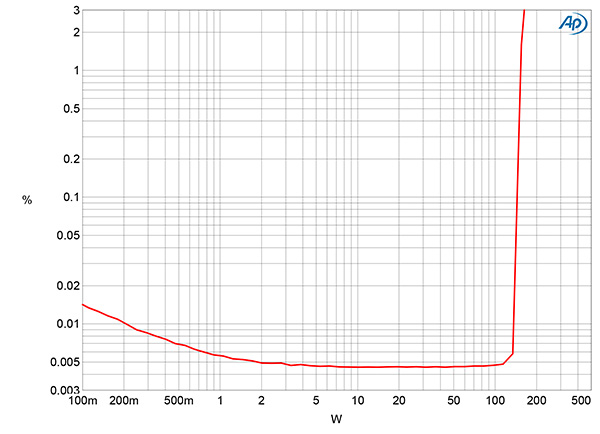
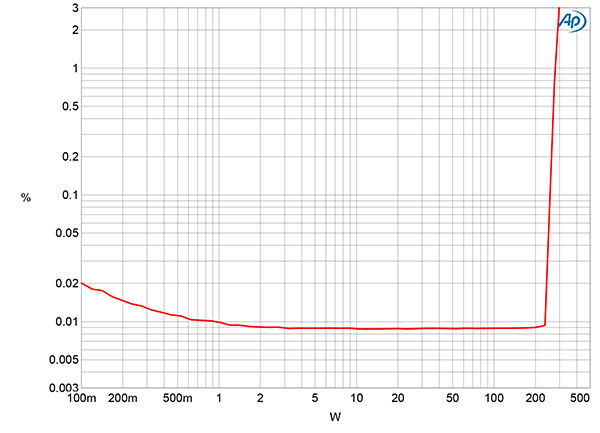
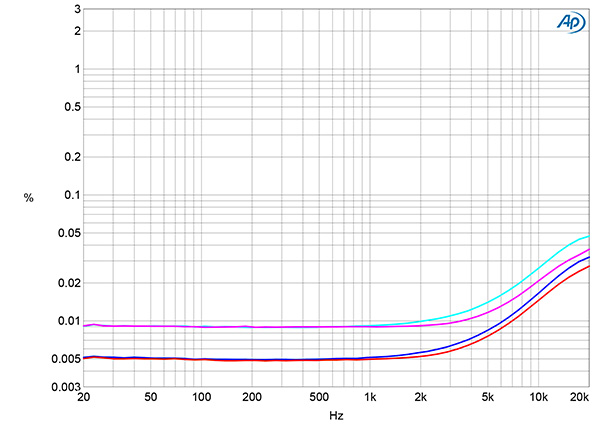
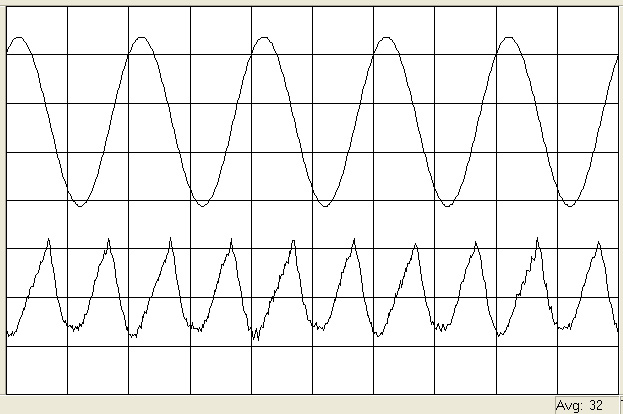
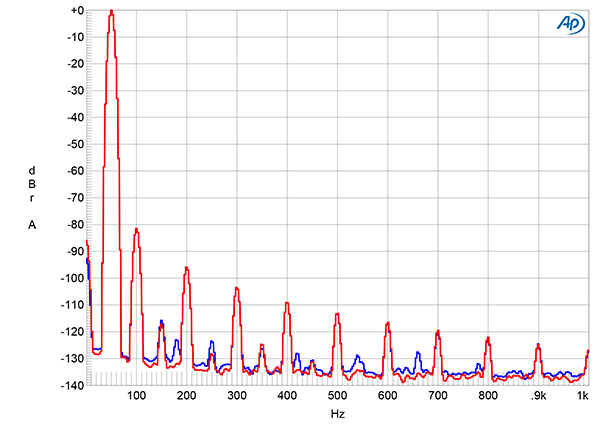
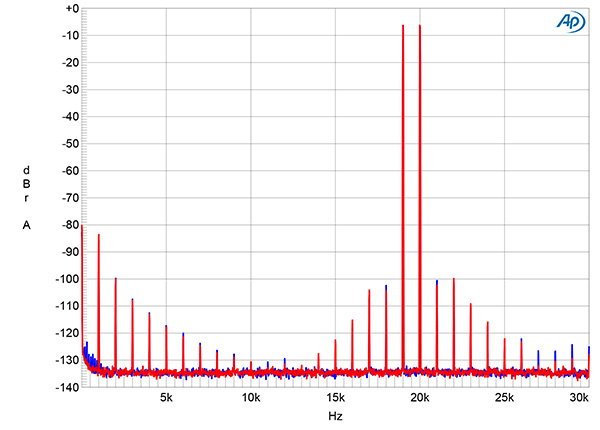
Fig.1 T+A R2500R, line input, frequency response at 2.83V into: simulated loudspeaker load (gray), 8 ohms (left channel blue, right red), 4 ohms (left cyan, right magenta), 2 ohms (green) (1dB/vertical div.).
Fig.2 T+A R2500R, line input, small-signal, 10kHz squarewave into 8 ohms.
The Preamplifier output impedance was a low 48 ohms at 1kHz and 20kHz rising to 147 ohms at 20Hz, presumably due to the presence of a series output-coupling capacitor. The headphone output impedance was a very low 6.6 ohms at 20Hz and 1kHz, 13.4 ohms at 20kHz. The loudspeaker output impedance was extremely low from 20Hz to 20kHz, at just 0.02 ohm. Consequently, the modulation of the R 2500 R's frequency response due to the Ohm's law interaction between this impedance and the impedance of our standard simulated loudspeaker was negligible (fig.1, gray trace). The amplifier's response into resistive loads with the bandwidth set to Wide was flat in the audioband, with its output into 8 ohms (blue and red traces) down by 3dB at 98kHz. (The –3dB frequency in Normal mode was the same with the analog inputs; this setting only applies to the digital inputs. See later.) Both the very close channel balance and the overall response were preserved at lower settings of the volume control and from the Preamplifier and headphone outputs. The R 2500 R's reproduction of a 10kHz squarewave (fig.2) had short risetimes and no overshoot or ringing.
Fig.3 T+A R2500R, line input, frequency response at 2.83V into 8 ohms with bass and treble controls set to the maximum, center, and minimum positions (left channel blue, right red) (2dB/vertical div.).
The behavior of the bass and treble tone controls set to their flat, maximum, and minimum settings is shown in fig.3. Some mild overlap in their passbands can be seen in this graph, and the maximum cut or boost is sensibly arranged, at +7.8dB/– 6dB in the treble and in the bass. Channel separation was excellent, at >'90dB in both directions below 2kHz and still 70dB, L–R, and 76dB, R–L, at 20kHz.
Fig.4 T+A R2500R, line input, spectrum of 1kHz sinewave, DC–1kHz, at 1Wpc into 8 ohms with volume control set to the maximum (left channel blue, right red), and to –20dB (left green, right gray) (linear frequency scale).
The wideband, unweighted signal/noise ratio, taken with the unbalanced input shorted to ground and the volume control set to its maximum, was an okay 66.5dB, left, and 64dB, right, ref. 2.83V, which is equivalent to 1W into 8 ohms. These ratios improved to 83.8dB when the measurement bandwidth was restricted to the audioband, and to 86.5dB when A-weighted. The blue and red traces in fig.4 show the R 2500 R's low-frequency noisefloor at 1Wpc into 8 ohms with the volume control set to its maximum; the green and gray traces show the noisefloor spectrum at the control set to –20dB and with the input signal increased by the same 20dB so that the output level remains at 2.83V. No power supply–related spuriae are present even at the maximum volume control setting, and the levels of the random noise components are reduced by up to 10dB at the lower setting of the control.
Fig.5 T+A R2500R, line input, distortion (%) vs 1kHz continuous output power into 8 ohms.
Fig.6 T+A R2500R, line input, distortion (%) vs 1kHz continuous output power into 4 ohms.
Figs.5 and 6, respectively, plot how the THD+noise percentage in the T+A's output varies with power into 8 ohms and 4 ohms with both channels driven. At our usual definition of clipping—when the THD+N reaches 1%—the R 2500 R exceeded its specified output powers of 140Wpc into 8 ohms (21.46dBW) and 250W into 4 ohms (21.0dBW), clipping at 151Wpc into 8 ohms (21.8dBW) and 280W into 4 ohms (21.46dBW).
Fig.7 T+A R2500R, line input, THD+N (%) vs frequency at 20V into: 8 ohms (left channel blue, right red), 4 ohms (left cyan, right magenta).
Fig.7 shows how the R 2500 R's THD+N percentage changed with frequency at 20V, equivalent to 50W into 8 ohms and 100W into 4 ohms. The distortion into 8 ohms (blue and red traces) is very low. It rises into 4 ohms (cyan and magenta traces), though to a still-low level. It also rises in the top two audio octaves into both impedances, due, presumably, to the limitation in the amplifier's open-loop bandwidth.
Fig.8 T+A R2500R, line input, 1kHz waveform at 50W into 8 ohms, 0.005% THD+N (top); distortion and noise waveform with fundamental notched out (bottom, not to scale).
Fig.9 T+A R2500R, line input, spectrum of 50Hz sinewave, DC–1kHz, at 100Wpc into 4 ohms (left channel blue, right red, linear frequency scale).
Fig.10 T+A R2500R, line input, HF intermodulation spectrum, DC–30kHz, 19+20kHz at 100Wpc peak into 4 ohms (left channel blue, right red, linear frequency scale).
The THD+N waveform taken at 50W into 8 ohms (fig.8) is dominated by the second harmonic. Spectral analysis (fig.9) indicates both that other even-order harmonics are present at lower levels and that odd-order harmonics are virtually absent. Intermodulation distortion was also extremely low in level, even into 4 ohms (fig.10). The second-order difference product with an equal mix of 19kHz and 20kHz tones lay at just –84dB (0.006%) ref. the peak signal level.—John Atkinson


