Sidebar 3: Measurements
A couple of years ago, DeVore Fidelity's John DeVore gave me a ride from Brooklyn, where we both live, to Michael Lavorgna's place, in New Jersey. John was delivering a preproduction pair of his Gibbon X loudspeakers for Michael to set up in his then-new listening room, and I'd tagged along to give them a listen (footnote 1). Michael's room and system sounded superb, and I made a mental note that when the Gibbon X went into production, we should review it. But, like all things that are important but not urgent, that idea remained on the back burner; instead, we spilled ink on DeVore's high-efficiency Orangutan models (footnote 2). So when Jim Austin suggested, in summer 2018, that he review the Gibbon X, I readily agreed.
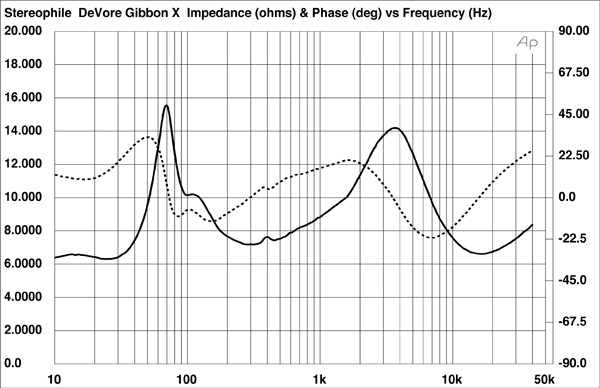
I used DRA Labs' MLSSA system and a calibrated DPA 4006 microphone to measure the Gibbon X's frequency response in the farfield, and an Earthworks QTC-40 mike for the nearfield and in-room responses. The DeVore's specified sensitivity is 91.5dB/2.83V/m; my estimate was slightly lower, at 88.8dB(B)/2.83V/m, this probably due, as you'll see below, to a lack of energy in the presence region. DeVore specifies the Gibbon X's impedance as 8.5 ohms. Fig.1, which shows how the X's impedance and electrical phase vary with frequency, shows that the magnitude drops below 8 ohms only in the low bass, the midrange, and above 10kHz. There are minimum values of a still-high 7.2 ohms at 305Hz and 6.1 ohms at 16kHz, though the impedance also drops to close to 6 ohms in the low bass. The electrical phase angle is generally low, and with its combination of high sensitivity and high impedance, the Gibbon X is relatively easy for an amplifier to drive.
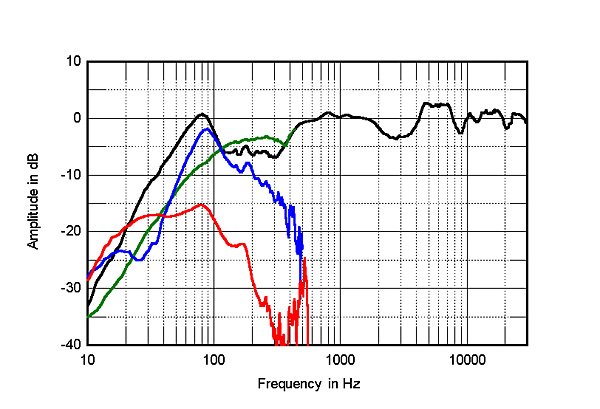 The green trace in fig.3 shows the nearfield response of the midrange drive-unit. Like the Silverback's midrange driver, it extends lower in frequency than you'd expect, with then a second-order rollout below 120Hz. There is also a sharp step upward in its output at 400Hz, which might be due to the absence of any baffle-step compensation in the crossover (footnote 4). The black trace below 300Hz in fig.3 shows the complex sum of the nearfield midrange, woofer, and port responses, taking into account acoustic phase and the different distances of each radiator from a nominal farfield microphone position. As with the Silverback Reference, though to a much lesser degree, the summed output of the midrange and woofer outputs is less than the midrange unit's alone. This suggests that the midrange driver and woofers are out of phase in the region where their outputs overlap, perhaps due to the use of a second-order crossover between the midrange and woofers. I suspect that this behavior lies behind JCA's finding that the Gibbon X sounded lean. (I measured both review samples; they behaved identically.)
Higher in frequency in fig.3, the black trace shows the DeVore's farfield response, averaged across a 30° horizontal window centered on the tweeter axis. (John DeVore told me that, unlike the Silverback Reference, in which the listening axis was level with the midrange driver, the listening axis of the Gibbon X is in-line with the tweeter.) The slight depression between 2 and 4kHz most likely contributes to the slightly-lower-than-specified sensitivity I measured. This presence-region dip is followed by an octave-wide, 2.5dB-high plateau, above which the Gibbon X's top-octave output is flat. When a speaker's response is flat on average, as the Gibbon X's is above 400Hz, the fact that there are peaks will, to some extent, be balanced by the fact that there are also dips, making it more difficult to detect the aberrations by ear. However, when Jim writes that "bright recordings sounded bright," I feel he's referring to the effect of the mid-treble response plateau, especially given the lack of presence-region energy. ("Brightness" is not a function of excess top-octave energy, which will be perceived as "air" or an emphasis of sibilance, neither of which Jim heard.)
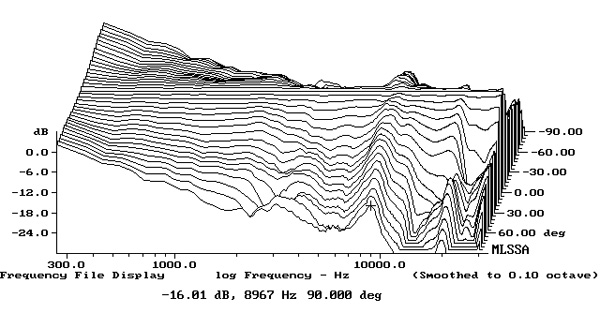
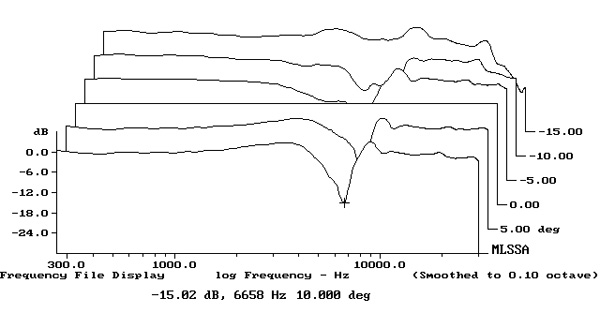
The plot of the Gibbon X's horizontal dispersion (fig.4) indicates that the speaker becomes relatively directional between 3 and 8kHz, which will reduce the audibility of its excess on-axis energy in that region. Supporting this idea is the fact that Jim ended up firing the Gibbon Xes straight ahead, which meant that he was listening off axis. In the vertical plane (fig.5), a sharply defined suckout at 6.6kHz develops 5° below the tweeter axis. This suggests that this is the upper crossover frequency, which is an octave and a half higher than usual for a ¾" tweeter. Sitting with your ears higher than the tweeter axis, which is 35" above the floor, will compensate to some extent for the on-axis brightness.
The green trace in fig.3 shows the nearfield response of the midrange drive-unit. Like the Silverback's midrange driver, it extends lower in frequency than you'd expect, with then a second-order rollout below 120Hz. There is also a sharp step upward in its output at 400Hz, which might be due to the absence of any baffle-step compensation in the crossover (footnote 4). The black trace below 300Hz in fig.3 shows the complex sum of the nearfield midrange, woofer, and port responses, taking into account acoustic phase and the different distances of each radiator from a nominal farfield microphone position. As with the Silverback Reference, though to a much lesser degree, the summed output of the midrange and woofer outputs is less than the midrange unit's alone. This suggests that the midrange driver and woofers are out of phase in the region where their outputs overlap, perhaps due to the use of a second-order crossover between the midrange and woofers. I suspect that this behavior lies behind JCA's finding that the Gibbon X sounded lean. (I measured both review samples; they behaved identically.)
Higher in frequency in fig.3, the black trace shows the DeVore's farfield response, averaged across a 30° horizontal window centered on the tweeter axis. (John DeVore told me that, unlike the Silverback Reference, in which the listening axis was level with the midrange driver, the listening axis of the Gibbon X is in-line with the tweeter.) The slight depression between 2 and 4kHz most likely contributes to the slightly-lower-than-specified sensitivity I measured. This presence-region dip is followed by an octave-wide, 2.5dB-high plateau, above which the Gibbon X's top-octave output is flat. When a speaker's response is flat on average, as the Gibbon X's is above 400Hz, the fact that there are peaks will, to some extent, be balanced by the fact that there are also dips, making it more difficult to detect the aberrations by ear. However, when Jim writes that "bright recordings sounded bright," I feel he's referring to the effect of the mid-treble response plateau, especially given the lack of presence-region energy. ("Brightness" is not a function of excess top-octave energy, which will be perceived as "air" or an emphasis of sibilance, neither of which Jim heard.)
The plot of the Gibbon X's horizontal dispersion (fig.4) indicates that the speaker becomes relatively directional between 3 and 8kHz, which will reduce the audibility of its excess on-axis energy in that region. Supporting this idea is the fact that Jim ended up firing the Gibbon Xes straight ahead, which meant that he was listening off axis. In the vertical plane (fig.5), a sharply defined suckout at 6.6kHz develops 5° below the tweeter axis. This suggests that this is the upper crossover frequency, which is an octave and a half higher than usual for a ¾" tweeter. Sitting with your ears higher than the tweeter axis, which is 35" above the floor, will compensate to some extent for the on-axis brightness.
Footnote 1: The DeVore Gibbon Xes are featured in this 2017 interview with Michael Lavorgna, at that time editor of our AudioStream site. Footnote 2: See, for example, here and here. Footnote 3: See fig.1 here. Footnote 4: The midrange driver will have reduced output below the frequency at which the baffle width is equal to a half wavelength, which is where a loudspeaker's radiation pattern is changing from omnidirectional or spherical to half-space or hemispherical. This wouldn't usually be a problem, but the extended low-frequency response of the Gibbon X's midrange driver and the speaker's narrow baffle will bring it into play.
Fig.1 DeVore Fidelity Gibbon X, electrical impedance (solid) and phase (dashed) (2 ohms/vertical div.).
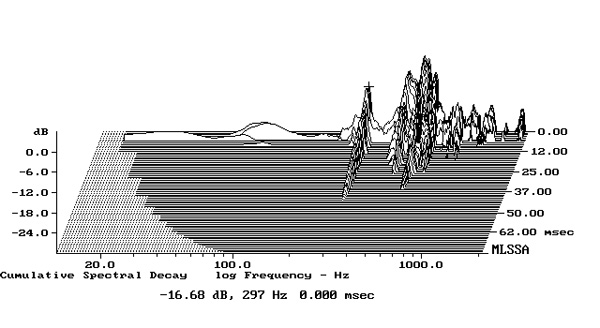
A suspicious-looking bump at 400Hz in the impedance-magnitude trace suggests some sort of enclosure problem at that frequency. However, when I investigated the panels' vibrational behavior with a plastic-tape accelerometer, I found nothing amiss at that frequency. The enclosure seemed mostly inert, and while I found some resonant modes on the front baffle (fig.2) and on the sidewalls below the woofers, these are all low in level and high in both frequency and Quality factor (Q), all of which should mitigate their audibility.
Fig.2 DeVore Fidelity Gibbon X, cumulative spectral-decay plot calculated from output of accelerometer fastened to front baffle halfway between tweeter and base (MLS driving voltage to speaker, 7.55V; measurement bandwidth, 2kHz).
Usually, the impedance-magnitude plot of a reflex loudspeaker has a saddle in the bass, the center frequency of which indicates the tuning of the port(s). However, there's only the slightest hint of a saddle in fig.1, roughly centered on 25Hz. In an e-mail, John DeVore had told me that the Gibbon X shared "a good deal of DNA" with his Silverback Reference loudspeaker, which Michael Fremer reviewed in March 2006. Looking at the Silverback's impedance (footnote 3), it does look as if the Gibbon X's woofer alignment is similar to that of the older speaker. The blue trace in fig.3 shows the output of the woofers, measured in the nearfield: there's a slight minimum-motion notch at 25Hz. The ports' nearfield response (red trace) does have a slight peak at 25Hz, but a stronger one at 80Hz, coincident with the woofers' maximum output. The levels of the woofer and port responses are plotted in the ratios of the square roots of their radiating areas, and it looks as if the ports don't fully extend the Gibbon X's output to their tuning frequency. However, as the ports are close to the speaker's base, their output will be increased by the boundary reinforcement provided by the adjacent floor, as I believe Jim Austin found in his listening.
Fig.3 DeVore Fidelity Gibbon X, anechoic response on tweeter axis at 50", averaged across 30° horizontal window and corrected for microphone response, with the nearfield midrange (green), woofers (blue), and ports (red) responses and their complex sum (black), respectively plotted below 450Hz, 500Hz, 550Hz, and 300Hz.
Fig.4 DeVore Fidelity Gibbon X, lateral response family at 50", normalized to response on tweeter axis, from back to front: differences in response 90–5° off axis, reference response, differences in response 5–90° off axis.
Fig.5 DeVore Fidelity Gibbon X, vertical response family at 50", normalized to response on tweeter axis, from back to front: differences in response 15–5° above axis, reference response, differences in response 5–10° below axis.
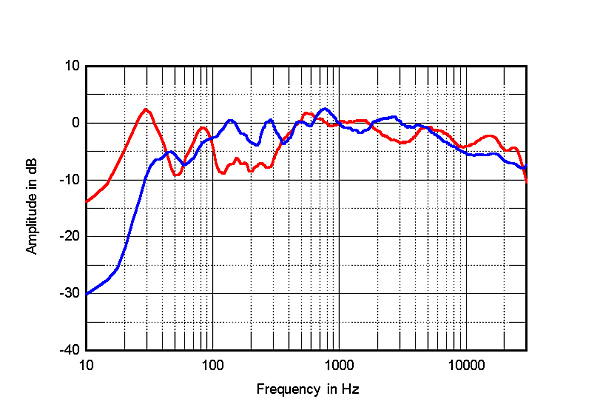
Puzzled by the Gibbon X's quasi-anechoic measurements, I examined its spatially averaged response in my listening room. (I average 20 1/6-octave–smoothed spectra, taken for the left and right speakers individually using a 96kHz sample rate, in a vertical rectangular grid 36" wide by 18" high and centered on the positions of my ears.) The result, with the speakers driven by an Ayre Acoustics EX-8 integrated amplifier, is shown as the red trace in fig.6. The DeVores' lack of energy in the lower midrange is very evident, particularly when compared with the spatially averaged response of the KEF LS50 minimonitors that usually live in my room (blue trace). As you'd expect, the DeVore has more low bass than the KEF and while the Gibbon X's low frequencies sounded very clean, the KEF produces audible second-harmonic distortion below 35Hz or so—its woofer is tiny compared to the Gibbon's twin 9" units. The KEF has more presence-region energy, which is to be expected given the DeVore's lack of energy in the same region in the anechoic measurements. But while the KEF's in-room response slopes smoothly down from 3 to 30kHz in textbook manner, the DeVore has a little too much energy above 10kHz.
Fig.6 DeVore Fidelity Gibbon X, spatially averaged, 1/6-octave response in JA's listening room (red), and of KEF LS50 (blue).
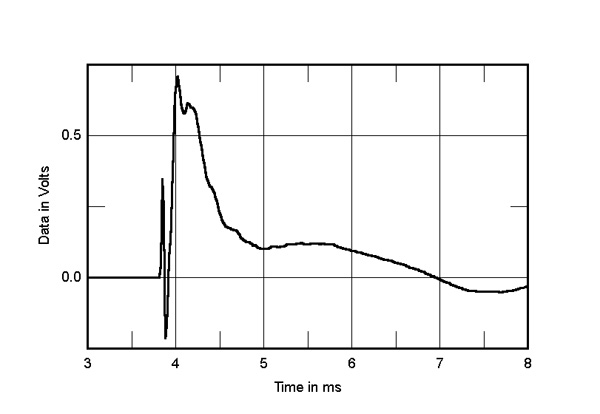
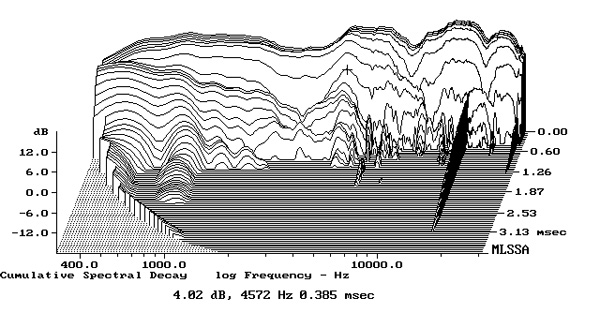
In the time domain, the Gibbon X's step response (fig.7) indicates that all of its drive-units are connected in positive polarity. The sharp spike at 3.7ms is the tweeter's step, followed by that of the midrange driver at 4ms; the slow rise just after 5ms is the woofers' step. The two samples were wired identically, with both woofers and the midrange unit in positive acoustic phase. Other than a ridge of low-level energy at 4.6kHz, the DeVore's cumulative spectral-decay plot (fig.8) was superbly clean.
Fig.7 DeVore Fidelity Gibbon X, step response on tweeter axis at 50" (5ms time window, 30kHz bandwidth).
Fig.8 DeVore Fidelity Gibbon X, cumulative spectral-decay plot on tweeter axis at 50" (0.15ms risetime).
In most respects, the Gibbon X offers good measured performance, with the speaker's departures from a flat on-axis response balanced by its horizontal and vertical dispersion. But, as with DeVore Fidelity's Silverback Reference, I remain puzzled by the choices that were made for the crossover between the midrange and low-frequency drivers, which will make optimizing the speaker positions more difficult than usual.—John Atkinson
Footnote 1: The DeVore Gibbon Xes are featured in this 2017 interview with Michael Lavorgna, at that time editor of our AudioStream site. Footnote 2: See, for example, here and here. Footnote 3: See fig.1 here. Footnote 4: The midrange driver will have reduced output below the frequency at which the baffle width is equal to a half wavelength, which is where a loudspeaker's radiation pattern is changing from omnidirectional or spherical to half-space or hemispherical. This wouldn't usually be a problem, but the extended low-frequency response of the Gibbon X's midrange driver and the speaker's narrow baffle will bring it into play.


