Sidebar 4: More Measurements
For digital-input testing, I used optical S/PDIF data, USB data sourced from my MacBook Pro, and network data played with Roon. Apple's AudioMIDI utility revealed that the USB port accepted 32-bit integer data sampled at all rates from 44.1kHz to 768kHz. The USB Prober app identified the Symphonia as "Symphonia" from "T+A elektroakustik" with the serial number "343636303133510D00320039," and indicated that the USB port operated in the optimal isochronous asynchronous mode. The optical and coaxial inputs only accepted data sampled at rates up to 96kHz—there was no output with 192kHz data, and the front-panel display showed a sample rate of 96kHz. The Symphonia had no problem with network and USB data sampled at 192kHz, however.
The Symphonia's digital inputs preserved absolute polarity from all the outputs. With the volume control set to "50" (–29.5dB) and the FIR Long reconstruction filter, the output level from the speaker output with a 1kHz tone at 0dBFS was 3.26V into 8 ohms. This is 20dB below the clipping voltage into that load; the Symphonia's DAC offers 10dB higher gain than is strictly necessary. The output level from the Headphone output with a full-scale 1kHz signal at the maximum volume control setting of "60" was 2.02V; from the Preamplifier output with the control set to "70," it was 2.61V. To avoid overloading the amplifier's output stage, I performed all the subsequent digital input testing at the Preamplifier output with the speaker output switched off.
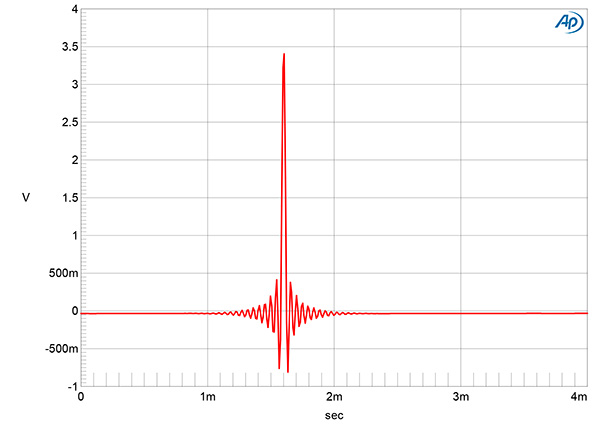
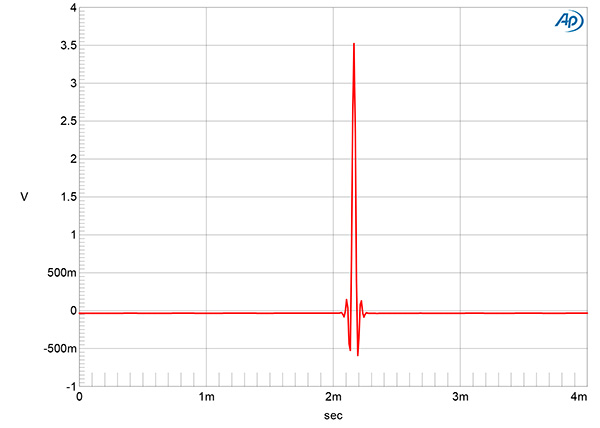
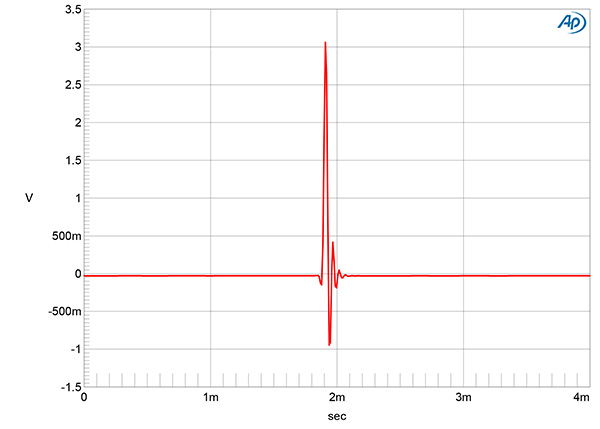
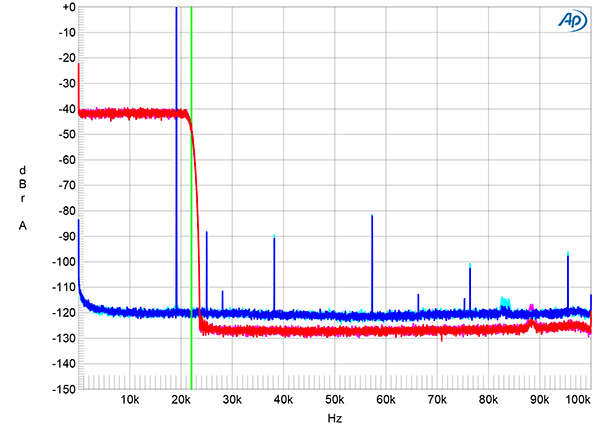
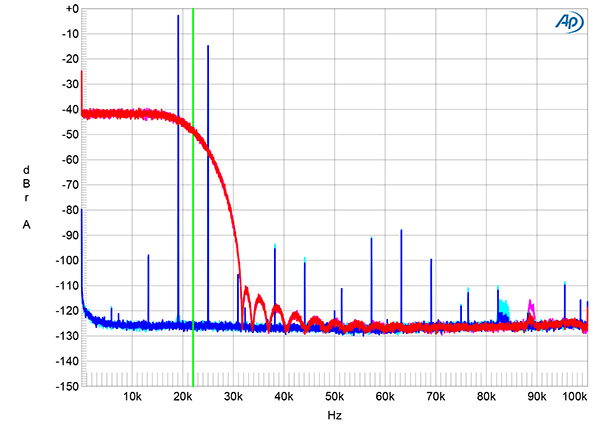
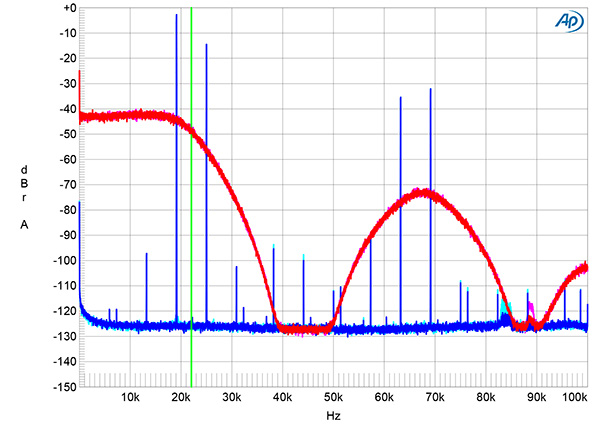
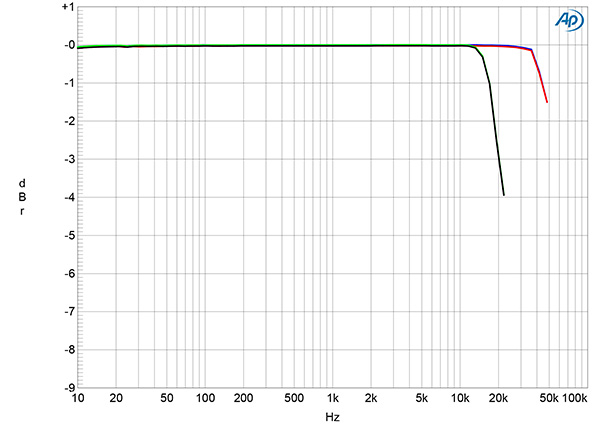
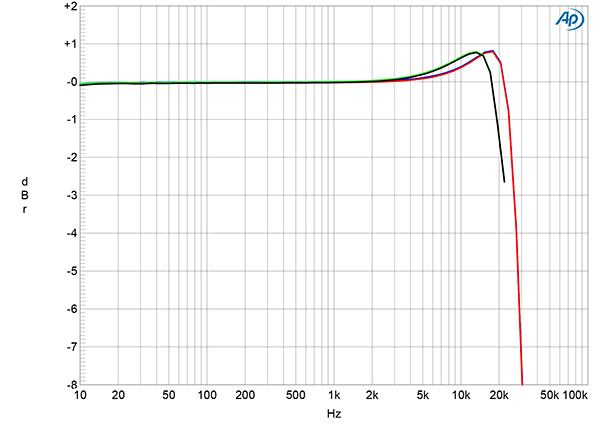
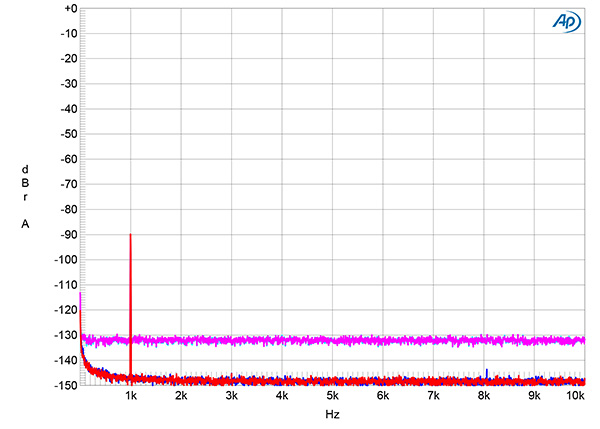
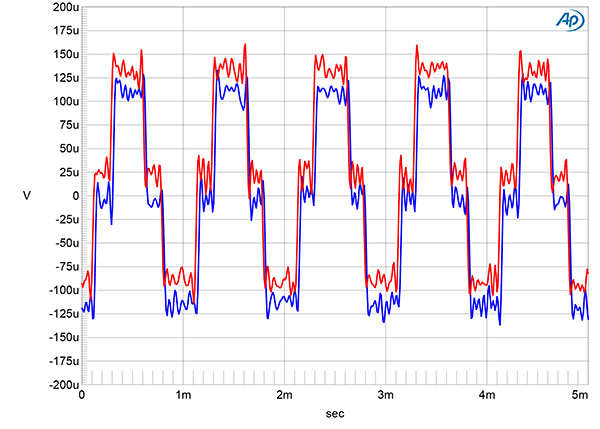
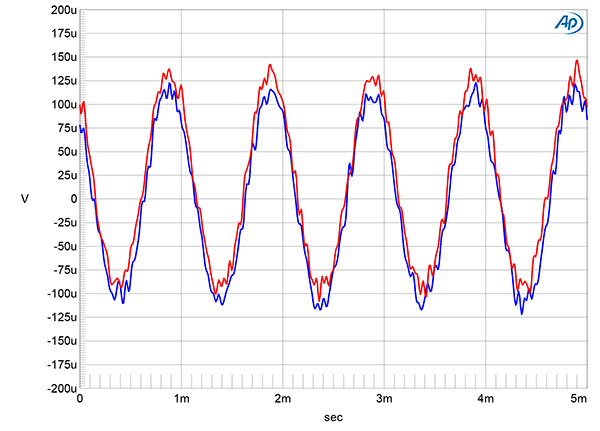
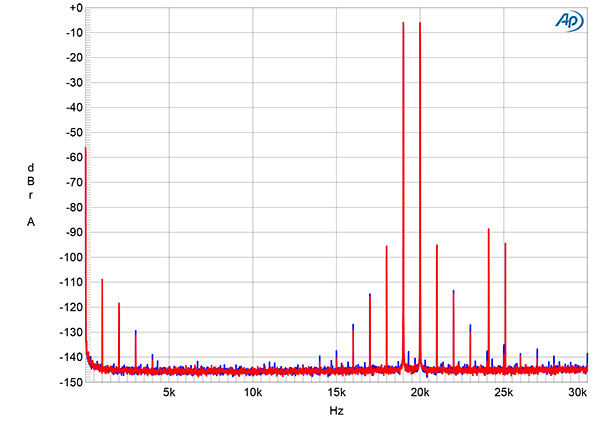
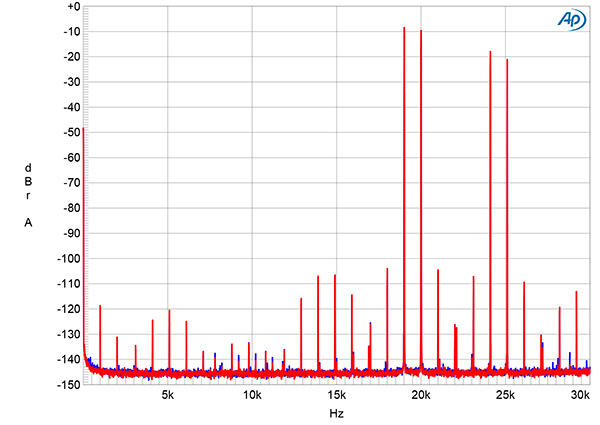
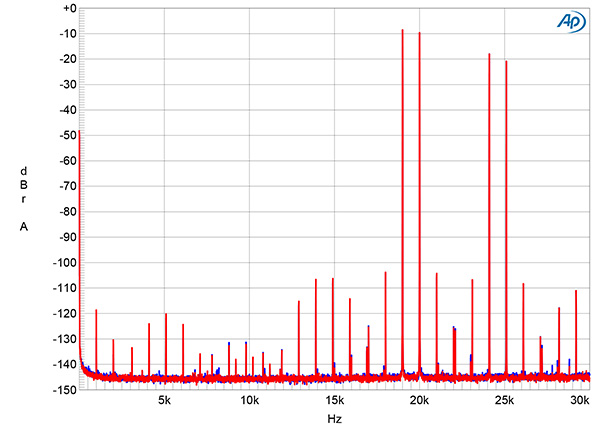
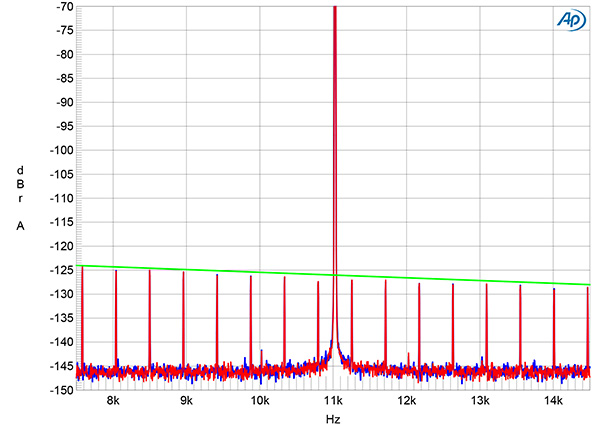
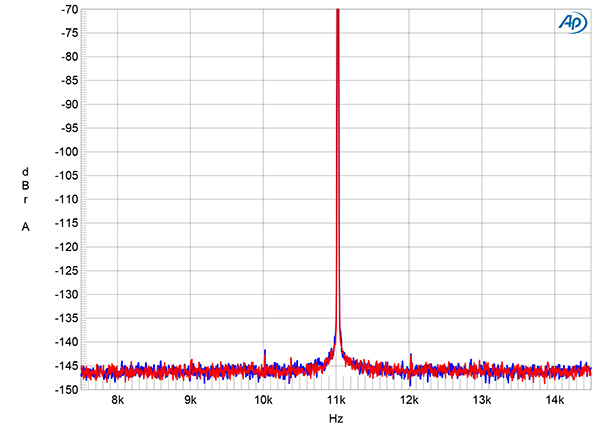
Fig.11 T+A Symphonia, digital inputs, FIR Long filter, impulse response (one sample at 0dBFS, 44.1kHz sampling, 4ms time window).
Fig.12 T+A Symphonia, digital inputs, FIR Short filter, impulse response (one sample at 0dBFS, 44.1kHz sampling, 4ms time window).
Fig.13 T+A Symphonia, digital inputs, Bezier/IIR filter, impulse response (one sample at 0dBFS, 44.1kHz sampling, 4ms time window).
The T+A Symphonia offers a choice of six reconstruction filters for PCM data. The FIR Long filter's impulse response (fig.11) was typical of a long linear-phase filter, with a large amount of ringing before and after a single sample at 0dBFS. Fig.12 shows the FIR Short filter's impulse response with 44.1kHz data; this filter is a very short linear-phase type, with a small amount of symmetrical ringing surrounding the single high sample. RvB told me he preferred the sound with this filter and with the Bezier/IIR filter. The latter's impulse response (fig.13) indicates that it is a short, hybrid type. The Bezier filter was an extremely short linear-phase type; as expected the NOS1 and NOS2 filters' impulse responses were time-perfect delta functions with no ringing.
Fig.14 T+A Symphonia, digital inputs, FIR Long filter, wideband spectrum of white noise at –4dBFS (left channel red, right magenta) and 19.1kHz tone at 0dBFS (left blue, right cyan) into 100k ohms with data sampled at 44.1kHz (20dB/vertical div.).
Fig.15 T+A Symphonia, digital inputs, FIR Short filter, wideband spectrum of white noise at –4dBFS (left channel red, right magenta) and 19.1kHz tone at 0dBFS (left blue, right cyan) into 100k ohms with data sampled at 44.1kHz (20dB/vertical div.).
Fig.16 T+A Symphonia, digital inputs, Bezier/IIR filter, wideband spectrum of white noise at –4dBFS (left channel red, right magenta) and 19.1kHz tone at 0dBFS (left blue, right cyan) into 100k ohms with data sampled at 44.1kHz (20dB/vertical div.).
The magenta and red traces in fig.14 show the FIR Long filter's ultrasonic rolloff with data sampled at 44.1kHz. They reach full stop-band attenuation just above half the sample rate (indicated by the vertical green line); the aliased image at 25kHz of a 19.1kHz tone at 0dBFS (cyan, blue) is suppressed by almost 90dB. The harmonics associated with the 19.1kHz tone all lie at or below –80dB (0.01%), with the third the highest in level. Repeating this test with the FIR Short filter gave the spectra shown in fig.15. The ultrasonic rolloff is much slower, and the image at 25kHz is suppressed by 10dB. The rolloff with the Bezier/IIR filter is even slower (fig.16), and relatively high-level images of the 19.1kHz tone are present between 60kHz and 70kHz. The Bezier filter's ultrasonic behavior was similar to the Bezier/IIR's, but the two NOS filters offered extremely slow ultrasonic rolloffs, with image levels in the audioband approaching –60dB.
Fig.17 T+A Symphonia, digital inputs, FIR Short filter, frequency response at –12dBFS into 100k ohms with data sampled at: 44.1kHz (left channel green, right gray) and 96kHz (left blue, right red) (1dB/vertical div.).
Fig.18 T+A Symphonia, digital inputs, Bezier/IIR filter, frequency response at –12dBFS into 100k ohms with data sampled at: 44.1kHz (left channel green, right gray) and 96kHz (left blue, right red) (1dB/vertical div.).
The frequency response with the FIR Long filter and data sampled at 44.1kHz and 96kHz was flat in the audioband with a sharp rolloff just below half of each sample rate. With the FIR Short filter, the output with 44.1kHz data was down by 3dB at 20kHz (fig.17). The Bezier, NOS1, and NOS2 filters gave increasingly less rolloff at 20kHz. The odd man out was the Bezier/IIR filter. Not only was the audioband response 1.45dB lower in level than with the other filters; a peak of almost 1dB was present in the top audio octave, and the response with 96kHz data (fig.18, blue and red traces) didn't extend much higher in frequency than with 44.1kHz data (green, gray traces).
Fig.19 T+A Symphonia, digital inputs, spectrum with noise and spuriae of dithered 1kHz tone at –90dBFS with: 16-bit data (left channel cyan, right magenta), 24-bit data (left blue, right red) (20dB/vertical div.).
Fig.20 T+A Symphonia, digital inputs, waveform of undithered 1kHz sinewave at –90.31dBFS, 16-bit data (left channel blue, right red).
Fig.21 T+A Symphonia, digital inputs, waveform of undithered 1kHz sinewave at –90.31dBFS, 24-bit data (left channel blue, right red).
An increase in bit depth from 16 to 24, with dithered data representing a 1kHz tone at –90dBFS, dropped the Symphonia's noisefloor by almost 20dB (fig.19), which implies a measured resolution of more than 18 bits. With undithered data representing a tone at exactly –90.31dBFS, the waveform was symmetrical, with negligible DC offset, and the three DC voltage levels described by the data were clearly defined (fig.20). With undithered 24-bit data (fig.21), the Symphonia output a relatively clean sinewave.
Fig.22 T+A Symphonia, digital inputs, FIR Long filter, HF intermodulation spectrum, DC–30kHz, 19+20kHz at 0dBFS, 24-bit/44.1kHz data (left channel blue, right red; linear frequency scale).
Fig.23 T+A Symphonia, digital inputs, FIR Short filter, HF intermodulation spectrum, DC–30kHz, 19+20kHz at 0dBFS, 24-bit/44.1kHz data (left channel blue, right red; linear frequency scale).
Fig.24 T+A Symphonia, digital inputs, Bezier/IIR filter, HF intermodulation spectrum, DC–30kHz, 19+20kHz at 0dBFS, 24-bit/44.1kHz data (left channel blue, right red; linear frequency scale).
As it had with the analog inputs, the T+A's digital inputs produced very low levels of harmonic and intermodulation distortion. Fig.22 shows the output spectrum with an equal mix of 19 and 20kHz tones, each at –6dBFS, and the FIR Long filter. Both the second-order intermodulation product at 1kHz and the higher-order products are very low in level, and the aliased images of the primary tones at 24.1kHz and 25.1kHz were suppressed by 90dB. Actual intermodulation distortion remained low in level with the FIR Short filter, though the aliased images are much higher in level (fig.23), as they were with the Bezier/IIR filter (fig.24).
Fig.25 T+A Symphonia, high-resolution jitter spectrum of analog output signal, 11.025kHz at –6dBFS, sampled at 44.1kHz with LSB toggled at 229Hz: 16-bit TosLink data (left channel blue, right red). Center frequency of trace, 11.025kHz; frequency range, ±3.5kHz.
Fig.26 T+A Symphonia, high-resolution jitter spectrum of analog output signal, 11.025kHz at –6dBFS, sampled at 44.1kHz with LSB toggled at 229Hz: 24-bit TosLink data (left channel blue, right red). Center frequency of trace, 11.025kHz; frequency range, ±3.5kHz.
The Symphonia's digital inputs offered superb rejection of data-related jitter. Fig.25 shows the output spectrum when the TosLink input was fed high-level 16-bit J-Test data. The odd-order harmonics of the undithered low-frequency, LSB-level squarewave all lie at the correct levels, and the central spike that represents the high-level tone at one-quarter the sample rate (Fs/4) is extremely narrow. Repeating this analysis with USB, Roon, and 16- and 24-bit data (fig.26) gave similarly superb results.
T+A's Symphonia offered generally excellent measured performance with both digital and analog input signals, offering high power combined with very low distortion.—John Atkinson