Sidebar 3: Measurements
 I performed a full set of measurements on the T+A Symphonia using my Audio Precision SYS2722 system. I controlled the amplifier both with the front-panel controls and with the T+A Music Navigator G3 app, which I installed on my iPad mini after connecting the amplifier's Ethernet port to my network. With the network connection active, Roon recognized the processor as the Roon Ready "T+A Symphonia."
As the Symphonia appears to use a class-D output stage and because class-D amplifiers emit relatively high levels of ultrasonic noise that would drive my analyzer's input into slew-rate limiting, I inserted an Audio Precision AUX-0025 passive low-pass filter between the test load and the analyzer. This filter mitigates noise above 80kHz and eliminates noise above 200kHz. Without the filter, there was 221mV of ultrasonic noise with a center frequency of 230kHz present in the amplifier's output. I used this filter for all the power amplifier tests other than frequency and tone control responses. I preconditioned the amplifier by running it at a moderate power into 8 ohms for 30 minutes before starting the testing.
Looking first at the Symphonia's single-ended line inputs, the amplifier preserved absolute polarity at all its outputs. The volume control operated in approximate 1.5dB steps, and with the volume control set to the maximum, "70," the voltage gain at 1kHz was 32.4dB from the loudspeaker outputs with an 8 ohm load. From the Preamplifier output, the gain was 0.95dB, and from the headphone output it was –1.3dB. (The maximum volume control setting was "60" for this output.) The maximum gain from the subwoofer output was 4.6dB at 50Hz. (This output is low-pass filtered; see later.) The line input impedance was 24k ohms at 20Hz and 1kHz, dropping inconsequentially to 15k ohms at 20kHz.
I performed a full set of measurements on the T+A Symphonia using my Audio Precision SYS2722 system. I controlled the amplifier both with the front-panel controls and with the T+A Music Navigator G3 app, which I installed on my iPad mini after connecting the amplifier's Ethernet port to my network. With the network connection active, Roon recognized the processor as the Roon Ready "T+A Symphonia."
As the Symphonia appears to use a class-D output stage and because class-D amplifiers emit relatively high levels of ultrasonic noise that would drive my analyzer's input into slew-rate limiting, I inserted an Audio Precision AUX-0025 passive low-pass filter between the test load and the analyzer. This filter mitigates noise above 80kHz and eliminates noise above 200kHz. Without the filter, there was 221mV of ultrasonic noise with a center frequency of 230kHz present in the amplifier's output. I used this filter for all the power amplifier tests other than frequency and tone control responses. I preconditioned the amplifier by running it at a moderate power into 8 ohms for 30 minutes before starting the testing.
Looking first at the Symphonia's single-ended line inputs, the amplifier preserved absolute polarity at all its outputs. The volume control operated in approximate 1.5dB steps, and with the volume control set to the maximum, "70," the voltage gain at 1kHz was 32.4dB from the loudspeaker outputs with an 8 ohm load. From the Preamplifier output, the gain was 0.95dB, and from the headphone output it was –1.3dB. (The maximum volume control setting was "60" for this output.) The maximum gain from the subwoofer output was 4.6dB at 50Hz. (This output is low-pass filtered; see later.) The line input impedance was 24k ohms at 20Hz and 1kHz, dropping inconsequentially to 15k ohms at 20kHz.
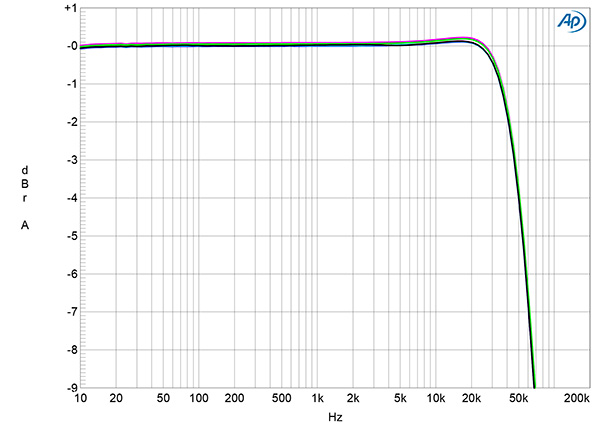
Fig.1 T+A Symphonia, line input, frequency response at 2.83V into: simulated loudspeaker load (gray), 8 ohms (left channel blue, right red), 4 ohms (left cyan, right magenta), 2 ohms (green) (1dB/vertical div.).
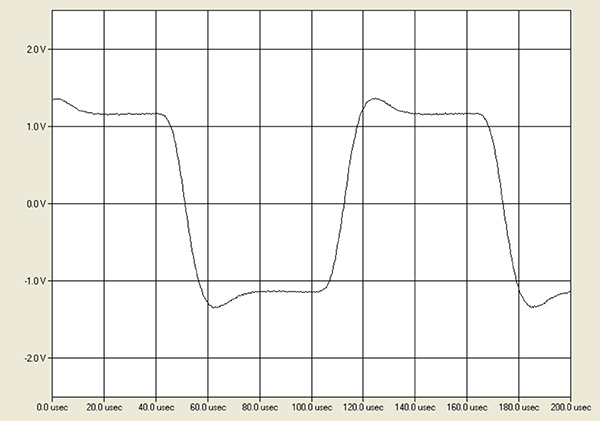
Fig.2 T+A Symphonia, line input, small-signal, 10kHz squarewave into 8 ohms.
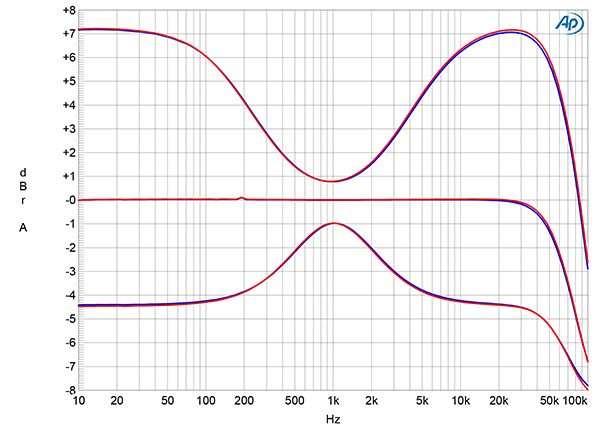
Fig.3 T+A Symphonia, line input, response at 500mW into 8 ohms with the treble and bass controls off and set to the maximum and minimum (left channel blue, right red; 2dB/vertical div.).
The loudspeaker output impedance was extremely low, at just 0.012 ohm. Consequently, the modulation of the Symphonia's frequency response due to the Ohm's law interaction between this impedance and the impedance of our standard simulated loudspeaker was negligible (fig.1, gray trace). The amplifier's response into resistive loads (blue, red, cyan, magenta, and green traces) was flat in the audioband, its output down by 4dB at 50kHz. Both the very close channel balance and the overall response were preserved at lower settings of the volume control. The Symphonia's reproduction of a 10kHz squarewave (fig.2) had a critically damped overshoot on the waveform's leading edges, correlating with the slight boost at 20kHz in the amplifier's response seen in fig.1. Fig.1 was taken with the Treble and Bass controls turned off. Fig.3 shows the response with them set to "0" and with maximum boosts and cuts of "+8" and "–6." The effect of the controls is slightly less than suggested by the numbers.
The Preamplifier output impedance was a low 54.5 ohms at 20Hz and 47.5 ohms at 1kHz and 20kHz. The Headphone output impedance was 7 ohms throughout the audioband. The Subwoofer output impedance was 46 ohms at 50Hz. The response from the Preamplifier and Headphone outputs extended to –1dB at 100kHz; from the Subwoofer output, the response started to roll off at 70Hz and was down by 3dB at 240Hz, as specified.
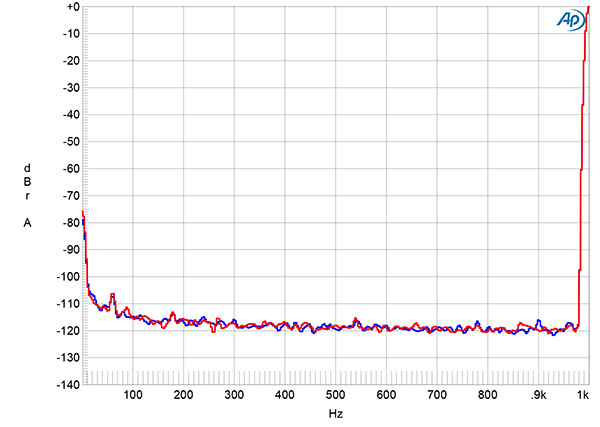
Fig.4 T+A Symphonia, line input, spectrum of 1kHz sinewave, DC–1kHz, at 1Wpc into 8 ohms with volume control set to the maximum (left channel blue, right red; linear frequency scale).
Channel separation was excellent, at >90dB below 2kHz, and still 70dB at 20kHz. The wideband, unweighted signal/noise ratio, taken with the unbalanced input shorted to ground, the volume control set to its maximum, and with the Audio Precision low-pass filter, was a good 76.5dB, left, and 79dB, right, ref. 2.83V, which is equivalent to 1W into 8 ohms. These ratios both improved to 85.6dB when the measurement bandwidth was restricted to the audioband, and to 88.4dB when A-weighted. The spectrum of Symphonia's low-frequency noisefloor at 1Wpc into 8 ohms with the volume control set to its maximum is shown in fig.4. Random noise components are low in level and were not affected by the volume control setting. No power supply–related spuriae are present.
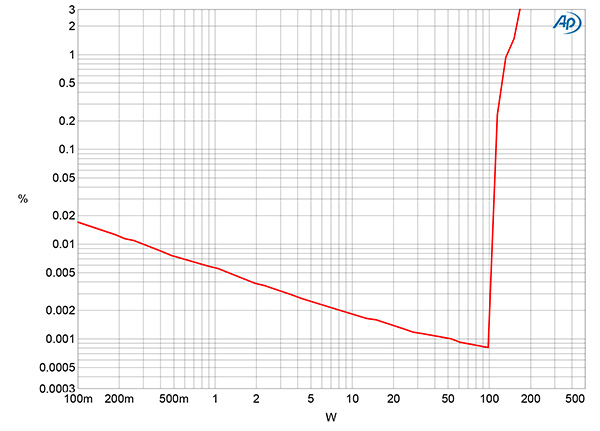
Fig.5 T+A Symphonia, line input, THD+N (%) vs 1kHz continuous output power into 8 ohms.
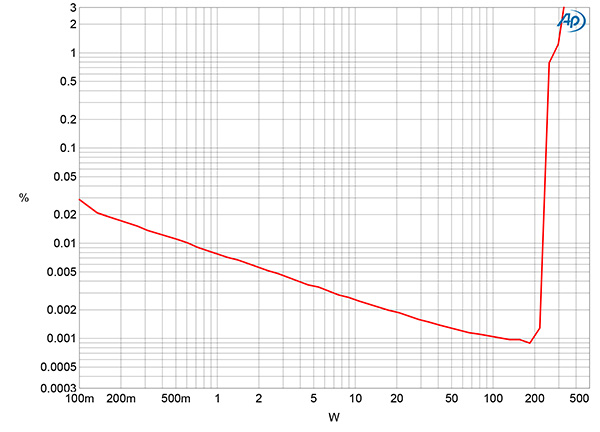
Fig.6 T+A Symphonia, line input, THD+N (%) vs 1kHz continuous output power into 4 ohms.
Figs.5 and 6 plot how the THD+noise percentage in the T+A's output varies with power into 8 ohms and 4 ohms with both channels driven. At our usual definition of clipping, which is when the THD+N reaches 1%, the Symphonia slightly exceeded its specified output powers of 125W into 8 ohms and 250W into 4 ohms (both equivalent to 21dBW). The clipping powers were 135Wpc into 8 ohms (21.3dBW) and 265Wpc into 4 ohms (21.2dBW). The FTC's updated "Amplifier Rule" states that maximum power should also be assessed at frequencies other than 1kHz. I therefore repeated the clipping test with a 20kHz signal. The THD+N reached 1% above the specified 125W into 8 ohms with this frequency.
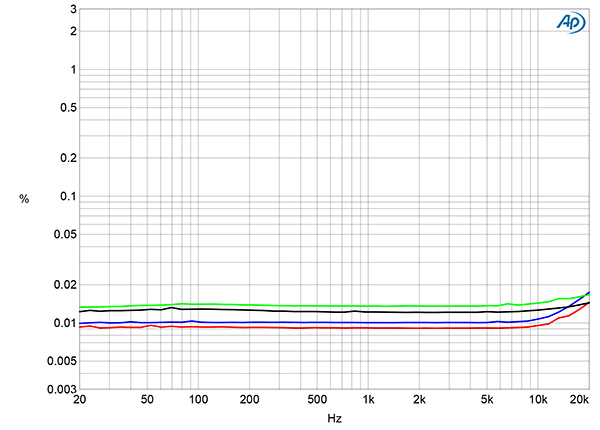
Fig.7 T+A Symphonia, line input, THD+N (%) vs frequency at 15.5V into: 8 ohms (left channel blue, right red), 4 ohms (left green, right gray).
The downward slope of the traces in figs.5 and 6 indicates that distortion lies beneath the noisefloor almost up to actual waveform clipping. Fig.7 shows how the Symphonia's THD+N percentage changed with frequency at 15.5V, which is equivalent to 30W into 8 ohms and 60W into 4 ohms. The distortion+noise into both loads is extremely low and rises only slightly in the top audio octave.
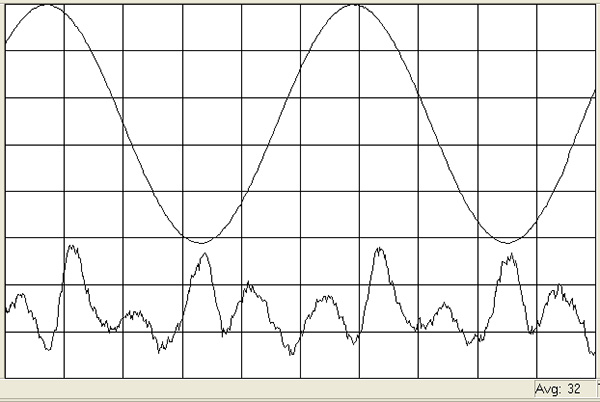
Fig.8 T+A Symphonia, line input, 1kHz waveform at 105W into 8 ohms, 0.0012% THD+N (top); distortion and noise waveform with fundamental notched out (bottom, not to scale).
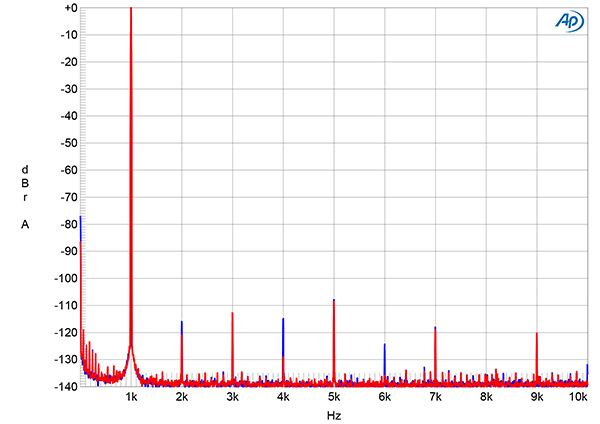
Fig.9 T+A Symphonia, line input, spectrum of 1kHz sinewave, DC–10kHz, at 105Wpc into 8 ohms (left channel blue, right red, linear frequency scale).
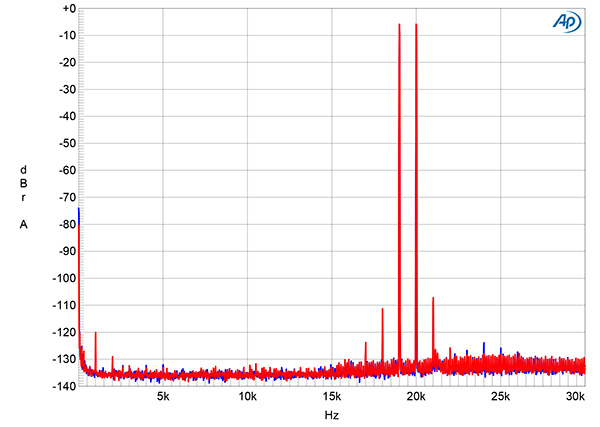
Fig.10 T+A Symphonia, line input, HF intermodulation spectrum, DC–30kHz, 19+20kHz at 105Wpc peak into 8 ohms (left channel blue, right red, linear frequency scale).
The THD+N waveform, taken at 105W into 8 ohms (fig.8), appears to comprise a mix of low-order harmonics, which was confirmed by spectral analysis (fig.9). The third and fifth harmonics are the highest in level but are negligible at near –110dB (0.0003%). Intermodulation distortion was also very low in level, even at a peak level just below clipping into 8 ohms (fig.10).—John Atkinson


