Sidebar 3: Measurements
I used DRA Labs' MLSSA system and a calibrated DPA 4006 microphone to measure the Bryston Middle T's frequency response in the farfield, and an Earthworks QTC-40 for the nearfield responses. (The grilles were left off for all the measurements.) My estimate of the Middle T's voltage sensitivity was 85dB(B)/2.83V/m, significantly lower than the specified 88dB/W/m.
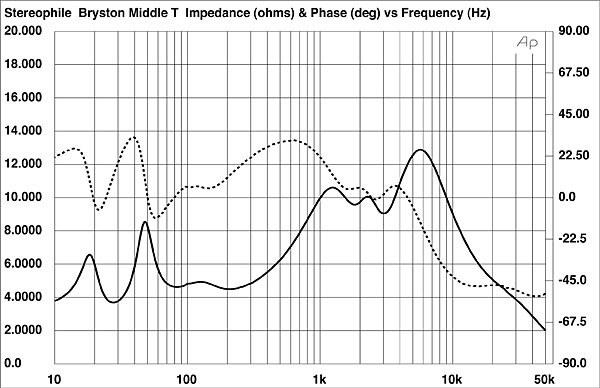
Though the Middle T's impedance is specified as 4 ohms, my measurement indicated that the magnitude remained above 4 ohms up to 30kHz (fig.1, solid trace). However, while the electrical phase angle (fig.1, dotted trace) is benign up to 8kHz or so, it becomes increasingly capacitive above that frequency, exceeding –45° above the audioband, where the magnitude also drops to as low as 2 ohms. The Middle T therefore starts to resemble a short circuit at ultrasonic frequencies, which will have an unpredictable effect on the partnering amplifier, depending on the program material. This impedance plot is very different in the top octaves both from those published in other reviews of this speaker and that supplied with the speaker, and was taken with an Audio Precision test system. I therefore repeated the measurement using DRA Labs' MLSSA system in impedance testing mode, and got a result identical to fig.1.
 Higher in frequency in fig.3, the woofers' low-pass rolloff is very shallow. Their output at 1kHz is just 6dB below that of the midrange unit, and while it rolls off rapidly above 1kHz, there are two peaks in the treble. I don't think these peaks are due to interference between the two woofers as I could hear their effect on pink noise with just the woofers operating. However, it's possible that they're masked when the midrange unit is active. The midrange driver's response is impressively flat, though the tweeter's output gently rises on axis. The tweeter's primary dome resonance occurs around 25kHz, which is significantly higher in frequency than the resonance shown in other published reviews.
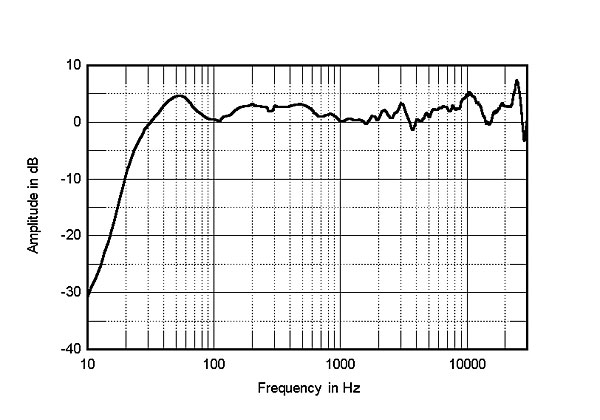
Fig.4 shows that the Bryston speaker's bass is down by 6dB at the port tuning frequency, as expected, which correlates with KR's finding that the bass extension is "substantial." The Middle T's farfield response has a slight "smile" characteristic, the decade between 500Hz and 5kHz generally 2–3dB lower in level than the regions to either side. However, the slight peak just above 3kHz might tie in with KR's comment that the Brystons "seemed to place images just a bit more forward in terms of distance, though not of character."
Higher in frequency in fig.3, the woofers' low-pass rolloff is very shallow. Their output at 1kHz is just 6dB below that of the midrange unit, and while it rolls off rapidly above 1kHz, there are two peaks in the treble. I don't think these peaks are due to interference between the two woofers as I could hear their effect on pink noise with just the woofers operating. However, it's possible that they're masked when the midrange unit is active. The midrange driver's response is impressively flat, though the tweeter's output gently rises on axis. The tweeter's primary dome resonance occurs around 25kHz, which is significantly higher in frequency than the resonance shown in other published reviews.
Fig.4 shows that the Bryston speaker's bass is down by 6dB at the port tuning frequency, as expected, which correlates with KR's finding that the bass extension is "substantial." The Middle T's farfield response has a slight "smile" characteristic, the decade between 500Hz and 5kHz generally 2–3dB lower in level than the regions to either side. However, the slight peak just above 3kHz might tie in with KR's comment that the Brystons "seemed to place images just a bit more forward in terms of distance, though not of character."
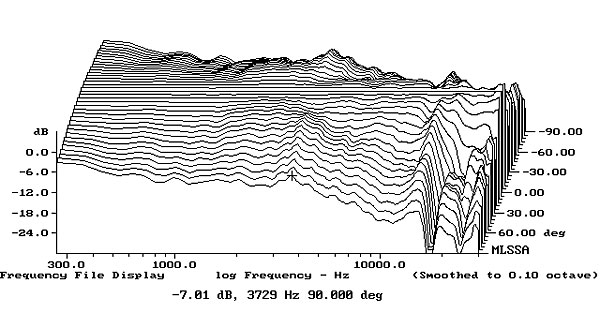
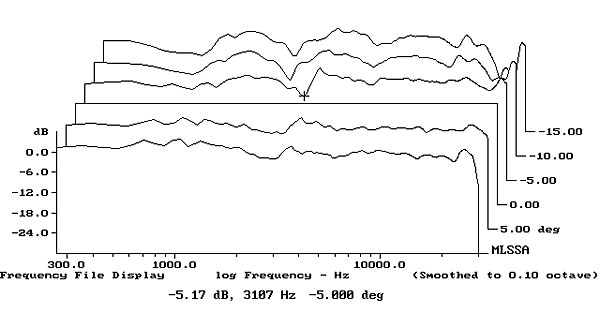
 The Middle T's lateral dispersion, referenced to the response on the tweeter axis, is shown in fig.5. The contour lines in this graph are generally smooth and evenly spaced, correlating with the good imaging performance. This graph shows that the suckouts between 3 and 4kHz and around 15kHz in the on-axis response fill in to the speaker's sides, which will render the in-room treble smooth. Overall, however, the Middle T is relatively directional in the top two audio octaves, which will tend to balance the excess of energy in this region on axis. In the vertical plane (fig.6), the Bryston's output doesn't change much over a wide angle (±10°) centered on the tweeter axis, which is 38" above the floor.
 In the time domain, the Middle T's step response on the tweeter axis (fig.7) indicates that all four drive-units are connected with positive acoustic polarity. The smooth blending of the tweeter and midrange steps indicates optimal crossover design, while looking at the individual steps reveals that the outputs of the midrange unit and woofers arrive coincidentally at the microphone. The cumulative spectral-decay plot on the tweeter axis (fig.8) is generally impressively clean, though with a slight ridge of delayed energy at the frequency of the peak in the woofers' response.
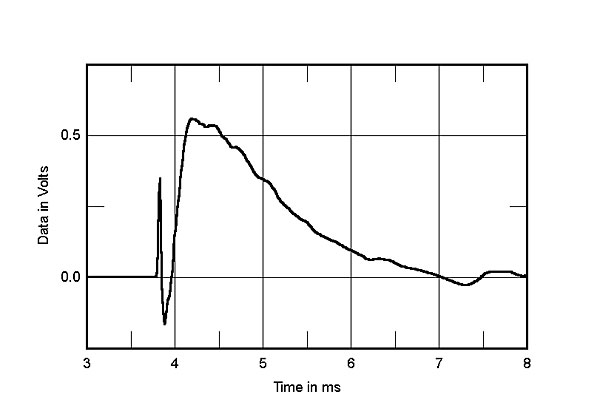
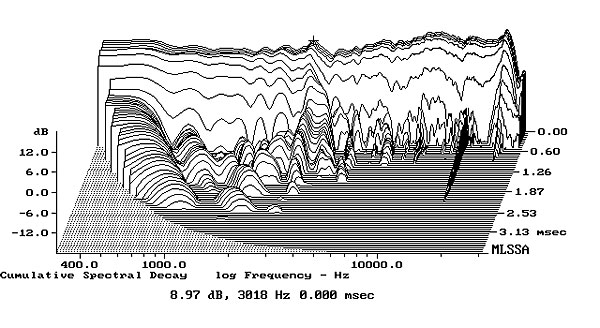
Fig.1 Bryston Middle T, electrical impedance (solid) and phase (dashed) (2 ohms/vertical div.).
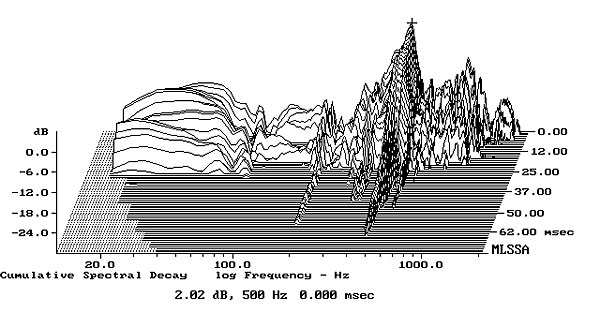
The impedance traces are free from the small wrinkles in the midrange that would suggest the presence of enclosure resonances. However, the rear half of the Middle T's cabinet sounded very lively to a knuckle rap, and when I investigated the vibrational behavior with an accelerometer, I found a strong mode at 500Hz on the sidewalls level with the midrange drive-unit and adjacent to the ports (fig.2), with another strong mode at 250Hz level with the upper and lower woofers. The section of the sidewalls adjacent to the midrange unit was much better damped. Whether or not these resonances will degrade sound quality will depend on the areas of the affected panels. It is fair to note that Kal Rubinson didn't note any midrange congestion or coloration that might have resulted from this behavior, though I see that he commented that "there seemed to be just a bit more lower midrange than I thought was right."
Fig.2 Bryston Middle T, cumulative spectral-decay plot calculated from output of accelerometer fastened to center of side panel (MLS driving voltage to speaker, 7.55V; measurement bandwidth, 2kHz).
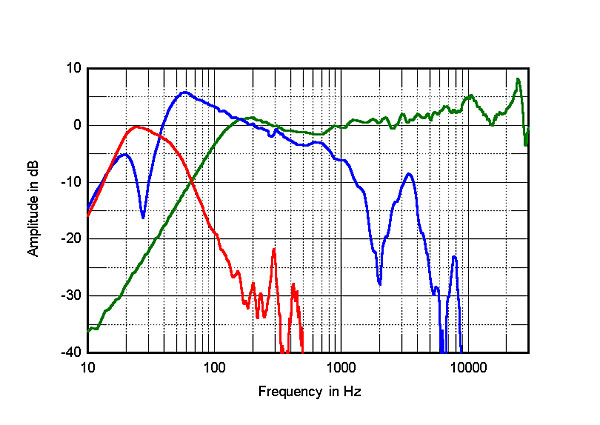
The two woofers behaved identically, as did the two ports. The blue trace in fig.3 shows the response of the woofers, measured in the nearfield below 350Hz and in the farfield above that frequency, while the red trace shows the nearfield response of the ports. Below 350Hz, the green trace in this graph shows the nearfield response of the midrange unit, with the farfield output of the midrange and tweeter on the tweeter axis shown above that frequency. The woofers appear to peak in the upper bass, but this is primarily an artifact of the nearfield measurement technique. The notch at 27Hz in their output confirms that this is the tuning frequency of the twin ports and that their combined output peaks between 20 and 50Hz, implying good low-frequency extension. There are two peaks in the ports' output between 300 and 450Hz; though both are relatively low in level, the peak lower in frequency does give rise to a suckout in the woofers' nearfield output.
Fig.3 Bryston Middle T, acoustic crossover on tweeter axis at 50", corrected for microphone response, with nearfield responses of midrange unit (green), woofers (blue), ports (red), respectively plotted below 350Hz, 350Hz, 500Hz.
Fig.4 Bryston Middle T, anechoic response on tweeter axis at 50", averaged across 30° horizontal window and corrected for microphone response, with complex sum of nearfield responses plotted below 300Hz.
Fig.5 Bryston Middle T, lateral response family at 50", normalized to response on tweeter axis, from back to front: differences in response 90–5° off axis, reference response, differences in response 5–90° off axis.
Fig.6 Bryston Middle T, vertical response family at 50", normalized to response on tweeter axis, from back to front: differences in response 15–5° above axis, reference response, differences in response 5–10° below axis.
Fig.7 Bryston Middle T, step response on tweeter axis at 50" (5ms time window, 30kHz bandwidth).
Fig.8 Bryston Middle T, cumulative spectral-decay plot on tweeter axis at 50" (0.15ms risetime).
Although I was somewhat puzzled by the crossover between the Middle T's woofers and midrange unit, and didn't like to see that lively enclosure, the speaker's measured performance generally indicates a well-balanced design. And again I must point out that excellent cumulative spectral-decay plot. It is uncommon to see a large, affordable tower speaker with so clean an initial decay.—John Atkinson


