Sidebar 3: Measurements
After carefully installing the Triode Lab 2A3 EVO's tubes, I performed a complete set of tests of the amplifier with my Audio Precision SYS2722 system using the Electro-Harmonix 2A3 Gold output tubes, then repeated the testing with the KR 2A3 tubes that KM told me he preferred. As usual, I waited for an hour after powering up the amplifier before starting the testing.
The 2A3 EVO inverted polarity from both the 4 ohm and 8 ohm output transformer taps. The input impedance was a usefully high 61k ohms at 20Hz and 1kHz, 41k ohms at 20kHz. The source impedance from the 8 ohm output transformer taps with the KR tubes was relatively low, at 1 ohm from 20Hz to 20kHz. From the 4 ohm taps, the source impedance was 0.66 ohms at 20Hz and 1kHz, rising slightly to 0.72 ohms at 20kHz. The source impedance with the Electro-Harmonix tubes was slightly lower, at 0.85 ohms across the audioband from the 8 ohm taps, 0.6 ohms from the 4 ohm taps.
The 2A3 EVO's channel separation (not shown) was good, at >70dB in both directions between 400Hz and 5kHz. The separation decreased to 60dB at the top and bottom of the audioband. The unweighted, wideband signal/noise ratio (ref. 1W into 8 ohms), taken from the 8 ohm taps with the inputs shorted to ground and the volume control set to its maximum, was 63.3dB in the left channel, 60.1dB in the right. These ratios remained the same when the measurement bandwidth was restricted to 22Hz–22kHz but increased to 89.4dB, left, and 84.9dB, right, when A-weighted. The ratios from the 4 ohm outputs, with their lower gain, were 3dB better.
Troubled by the differences in distortion and noisefloor in the two channels, I swapped all the tubes between the channels and repeated some of the tests. The second harmonic and second-order intermodulation product were now higher in the right channel, and the random noisefloor was now higher in the left channel rather than the right. These results suggest that one of the input tubes or the driver tubes had aged out of specification.
The Triode Lab 2A3 EVO's measured performance is what I would expect from a design with a single-ended, tubed output stage and little or no loop negative feedback. While the maximum power is limited and the distortion at lower powers is relatively high in level, the cleanly extended high frequencies and the excellent squarewave performance, coupled with the fact that the distortion doesn't rise at low frequencies, indicate that the output transformers are of high quality.—John Atkinson
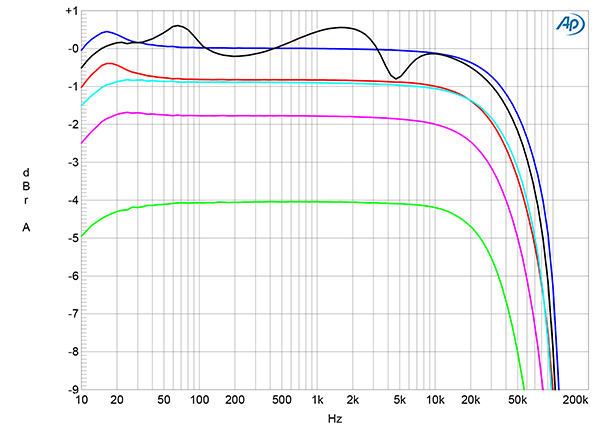
Fig.1 Triode Lab 2A3 EVO, Electro-Harmonix output tubes, 8 ohm output tap, frequency response at 2.83V into: simulated loudspeaker load (right channel, gray), 8 ohms (left channel blue, right red), 4 ohms (left cyan, right magenta), and 2 ohms (green) (2dB/vertical div.).
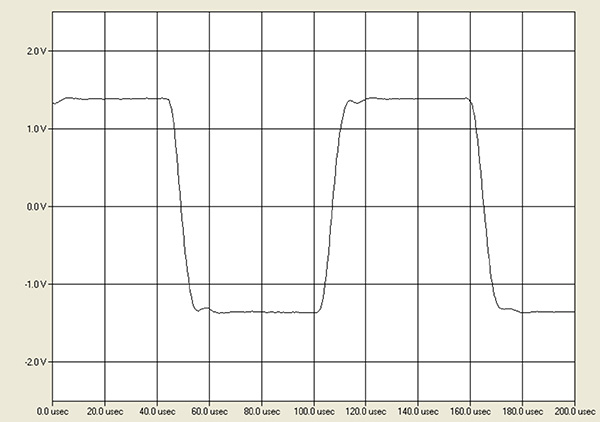
Fig.2 Triode Lab 2A3 EVO, Electro-Harmonix output tubes, small-signal 10kHz squarewave into 8 ohms.
With the KR tubes and the volume control set to its maximum, the left channel's voltage gain into 8 ohms was a low 23.4dB from the 8 ohm tap and 20.8dB from the 4 ohm tap. The maximum gain with the Electro-Harmonix tubes was slightly higher, at 24.5dB and 21.0dB, respectively. The right channel's gain was around 0.8dB lower than the left's, which can be seen in fig.1, which plots the Triode Lab's small-signal frequency response from the 8 ohm taps. The response in both channels is flat in the audioband; into 8 ohms (blue trace), it is down by 3dB at 70kHz. No ultrasonic resonant peaks are present. The variation in the frequency response with our standard simulated loudspeaker (gray trace), due to the Ohm's law interaction between the source impedance and that of the load, was relatively low for a tubed amplifier, at ±0.7dB. The response variation with the simulated speaker from the 4 ohm tap was lower, at ±0.4dB. Fig.1 was taken with the Electro-Harmonix tubes and the volume control set to its maximum. The channel imbalance and high-frequency –3dB point were identical with the KR tubes and at lower settings of the volume control. However, with the control set to –12dB, the output below 30Hz rose by up to 2dB. The Triode Lab's reproduction of a 10kHz squarewave into 8 ohms was excellent, with a small, critically damped overshoot on the leading edges (fig.2).
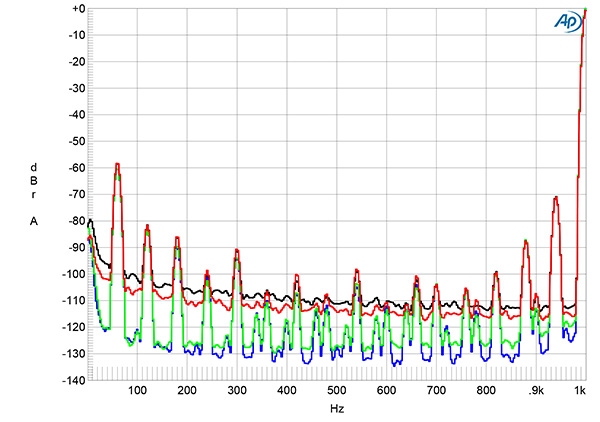
Fig.3 Triode Lab 2A3 EVO, Electro-Harmonix output tubes, 8 ohm output tap, spectrum of 1kHz sinewave, DC–1kHz, at 1Wpc into 8 ohms with volume control set to its maximum (left channel blue, right red) and to –12dB (left green, right gray) (linear frequency scale).
Spectral analysis of the low-frequency noisefloor while the Triode Lab integrated's 8 ohm taps drove a 1kHz tone at 1Wpc into 8 ohms and with the volume control set to the maximum (fig.3) revealed relatively high levels of power supply–related spuriae in both channels. Random noise was lower in level in the left channel (blue trace) than the right (red trace). Repeating the analysis with the volume control set to –12dB and the input signal level higher by the same 12dB (green, gray traces) didn't significantly change the levels of supply-related spuriae or random noise.
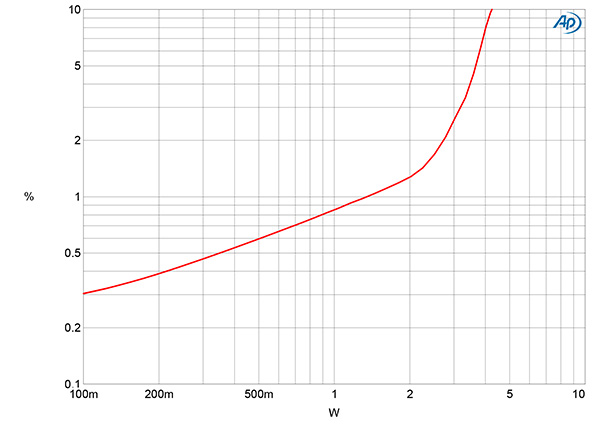
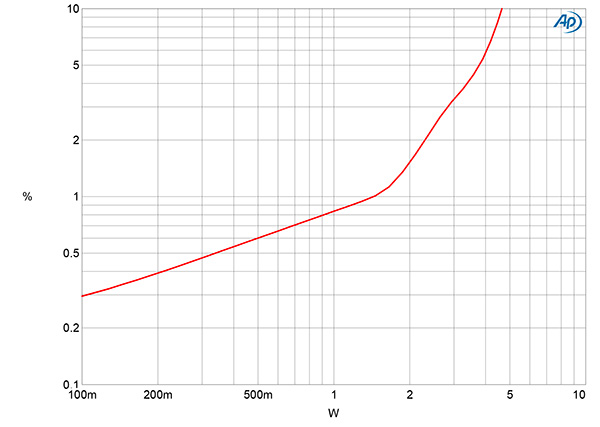
Fig.4 Triode Lab 2A3 EVO, KR output tubes, 8 ohm output tap, distortion (%) vs 1kHz continuous output power into 8 ohms.
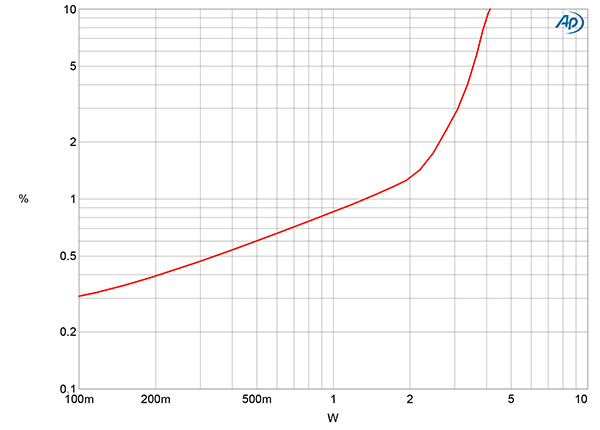
Fig.5 Triode Lab 2A3 EVO, KR output tubes, 4 ohm output tap, distortion (%) vs 1kHz continuous output power into 8 ohms.
Fig.6 Triode Lab 2A3 EVO, KR output tubes, 4 ohm output tap, distortion (%) vs 1kHz continuous output power into 4 ohms.
Triode Lab specifies a maximum output power of "3.5W–5W+ depending on the model and output transformers." Looking at how the left channel's THD+N percentage changed with power, the 2A3 EVO fitted with the KR tubes output just 1.5W from the 8 ohm tap into 8 ohms with our usual definition of clipping, which is when the THD+noise reaches 1%. Relaxing that definition to 10% THD+N, the amplifier output 4.3W from the 8 ohm tap into 8 ohms (6.33dBW, fig.4), 3W from the 8 ohm tap driving 4 ohms (1.76dBW, not shown), 4.6W from the 4 ohm tap into 8 ohms (6.63dBW, fig.5), and 4.1W from the 4 ohm tap into 4 ohms (3.12dBW, fig.6). These maximum powers were very similar when I repeated the tests with the Electro-Harmonix tubes but with slightly higher distortion at low powers. The rise in the THD+N percentage as the power increases above 100mW in figs.4–6 suggests that the circuit has little or no loop negative feedback.
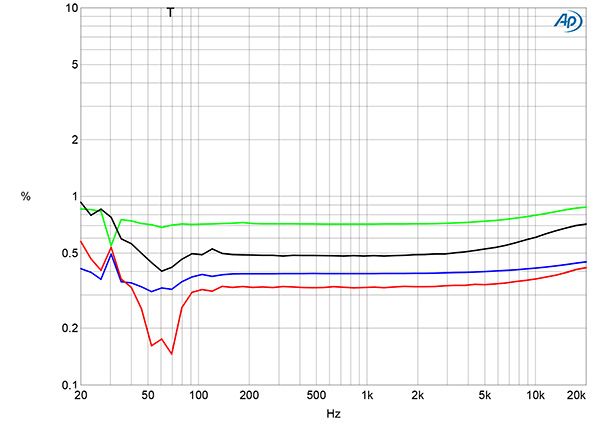
Fig.7 Triode Lab 2A3 EVO, Electro-Harmonix output tubes, 8 ohm output tap, THD+N (%) vs frequency at 1V into: 8 ohms (left channel blue, right red), 4 ohms (left green, right gray).
I examined how the percentage of THD+N in both channels varied with frequency at 1V (fig.7). The THD+N was lower in the right channel into both 8 ohms (red trace) and 4 ohms (gray trace) than it was in the left channel (blue and green traces) but is still relatively high in level despite the low output level. (The notch at 60Hz in the red trace is due to the signal being in opposite polarity to the hum at that frequency.)
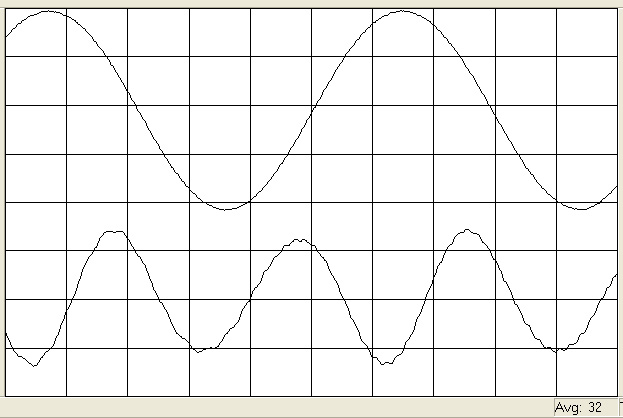
Fig.8 Triode Lab 2A3 EVO, Electro-Harmonix output tubes, 8 ohm output tap, left channel, 1kHz waveform at 1W into 8 ohms, 0.97% THD+N (top); distortion and noise waveform with fundamental notched out (bottom, not to scale).
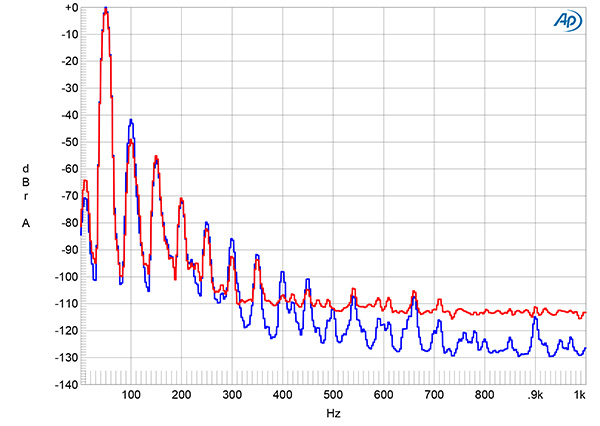
Fig.9 Triode Lab 2A3 EVO, KR output tubes, 8 ohm output tap, spectrum of 50Hz sinewave, DC–1kHz, at 1W into 8 ohms (left channel blue, right red; linear frequency scale).
The distortion waveform was predominantly the subjectively innocuous second harmonic (fig.8). It is higher in the left channel (fig.9, blue trace) than in the right channel (red trace). The third harmonic was equal in level in both channels, with higher-order harmonics much lower in level. As expected from fig.3, the level of the random noisefloor was lower in the left channel than in the right. Fig.9 was taken with the KR output tubes; the spectrum was identical with the Electro-Harmonix tubes.
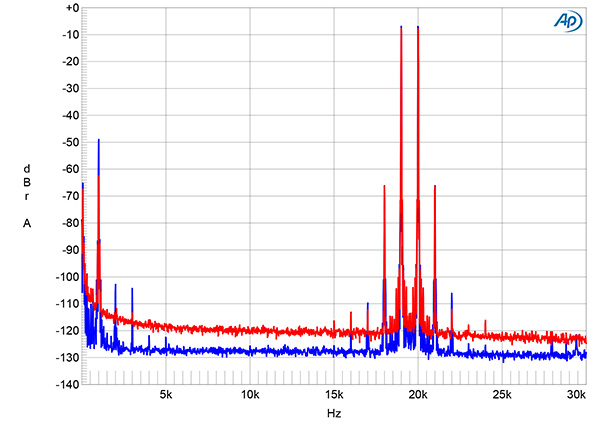
Fig.10 Triode Lab 2A3 EVO, KR output tubes, 8 ohm output tap, HF intermodulation spectrum, DC–30kHz, 19+20kHz at 1W peak into 8 ohms (left channel blue, right red; linear frequency scale).
Whether fitted with the KR output tubes or the Electro-Harmonix tubes, with the 2A3 EVO's 8 ohm tap driving an equal mix of 19 and 20kHz tones at 1W peak into 8 ohms (fig.10), the 1kHz difference product lay at –49dB (0.3%) in the left channel (blue trace) and at –61dB (0.1%) in the right channel (red trace). The higher-order intermodulation products at 18kHz and 21kHz were lower in level, at –67dB (0.05%) in both channels.