Sidebar: Measuring
I used my Audio Precision SYS2722 system to examine the M10 V3's measured performance. Other than the maximum gain being 8dB higher than that of the original M10, at 37.5dB into 8 ohms, the analog line-input performance was very similar to that of the original M10. The source impedance was still impressively low. The maximum power was 150Wpc into 8 ohms (21.75dBW) and 290Wpc into 4 ohms (21.6dBW) compared with the M10 V1's maximum power of 155Wpc into 8 ohms (21.9dBW) and 295Wpc into 4 ohms (21.7dBW). These powers were obtained at 1% THD+noise; the specified continuous power is 130Wpc into 8 ohms (21.15dBW) and 230Wpc into 4 ohms (20.6dBW), both at 0.1% THD. The distortion at high powers was significantly lower than the M10 V1's, at 0.005% at 100Wpc into 8 ohms compared with 0.06% at the same power into the same impedance.
With the digital inputs, a 1kHz signal at –20dBFS resulted in an output level of 15.47V into 8 ohms at the loudspeaker output with the volume control set to the maximum of "100%," compared with the original M10's 6.3V. This is an increase of 7.8dB, which correlates with the higher loudness I noted in my auditioning with Roon. A level of 15.47V is 7dB below the M10 V3's clipping voltage into 8 ohms; in absolute terms, the V3's digital inputs have 13dB too much gain.
To measure the phono input, I connected a wire from the grounding terminal on the amplifier's rear panel to the analyzer's ground to minimize noise. The input impedance was 36k ohms at 20Hz and 1kHz, 32.5k ohms at 20kHz. The phono input preserved absolute polarity from both the loudspeaker and preamplifier outputs, and the gain with the volume control set to "100%" was, respectively, 72.2dB and 40.5dB. All the subsequent measurements were performed at the M10 V3's preamplifier output.
Intermodulation distortion with an equal mix of 19kHz and 20kHz tones at a peak input level of 100mV was low, the difference product at 1kHz lying below –80dB (0.01%), though the levels of the higher-order products at 18kHz and 21kHz were closer to –60dB (0.1%).—John Atkinson
Footnote 1: This has been the case with almost all the integrated amplifiers with digital inputs that I have measured. I am beginning to suspect that is a deliberate decision on the part of the designer so that the volume control will be set lower than with analog sources in order to reduce the level of digital-domain artefacts.
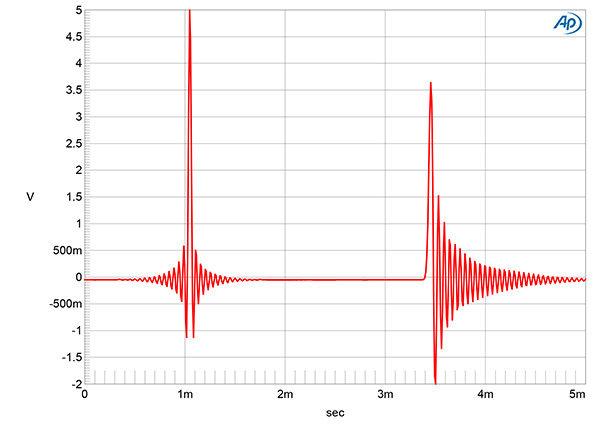
Fig.1 NAD M10, impulse response (left) and NAD M10 V3, impulse response (right) (one sample at 0dBFS, 44.1kHz data, 5ms time window).
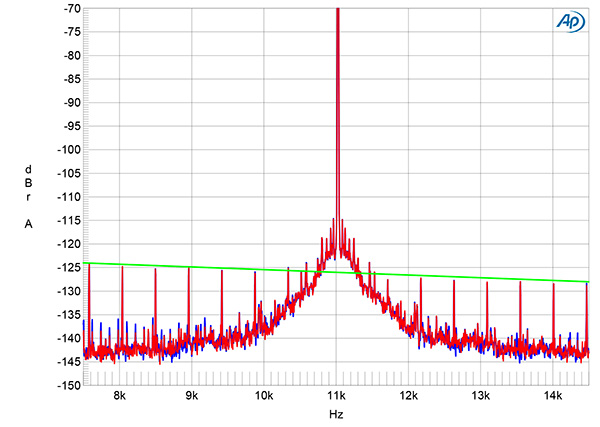
Fig.2 NAD M10 V3, 16-bit optical data, high-resolution jitter spectrum of analog output signal, 11.025kHz at –6dBFS, sampled at 44.1kHz with LSB toggled at 229Hz (left channel blue, right red). Center frequency of trace, 11.025kHz; frequency range, ±3.5kHz.
The M10 V1's reconstruction filter was a linear-phase type, with time-symmetrical ringing at either side of a single sample at 0dBFS (fig.1, left). The impulse response with 44.1kHz data indicated that the M10 V3's filter is now a minimum-phase type (fig.1, right), with all the Nyquist-frequency ringing following the high-level sample. The V3's measured resolution was very similar to that of the V1, at 18 bits. The rejection of word-clock jitter with both amplifiers was excellent, with the odd-order harmonics of the undithered low-frequency, LSB-level squarewave all lying at the correct levels. However, the spectral spike that represents the high-level tone at one-quarter the sample rate is broadened at its base with the M10 V3 (fig.2), which will be due to low-level, low-frequency random jitter. There were also low-level sidebands of unknown origin present in the V3's noisefloor at ±60Hz, ±100Hz, and ±156Hz.
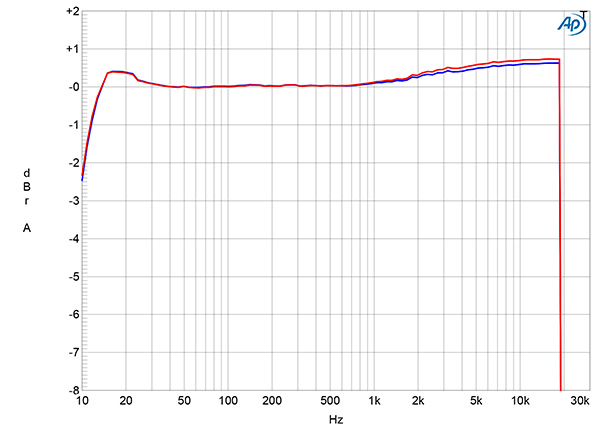
Fig.3 NAD M10 V3, phono input response with RIAA correction (left channel blue, right red) (1dB/vertical div.).
The error in the M10 V3's RIAA equalization (fig.3) was very low from the upper bass through the midrange, with superb channel matching, but rose by up to 0.8dB in the top octave. As with the line input, the phono input is digitized with what appears to be a sample rate of 44.1kHz; hence the response drops precipitously above 19kHz. The M10 V3 phono stage's unweighted, wideband S/N ratio, measured at the preamplifier output with the single-ended inputs shorted to ground and the volume control set to the maximum, was an okay 55.5dB (average of both channels) ref. 1kHz at 5mV. Restricting the measurement bandwidth to 22Hz–22kHz only increased the ratio by 1dB, while the A-weighted ratio was a good 66.2dB.
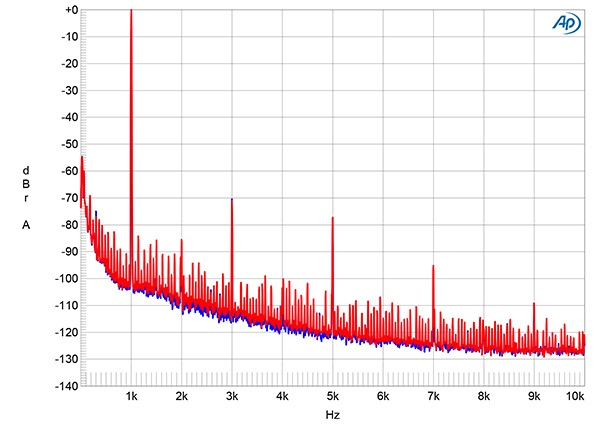
Fig.4 NAD M10 V3, phono input, spectrum of 1kHz sinewave, DC–10kHz, for 20mV input (left channel blue, right red, linear frequency scale, 20dB/vertical div.).
I measured the phono input's overload margins with the volume control set to "86%" (equivalent to –10dB) to make sure I was looking at actual input overload rather than output stage clipping. The margins ref. 1kHz at 5mV were a good 15.1dB across the audioband. Fig.4 shows the spectrum at the preamplifier output with a 1kHz signal at 20mV, 3dB below the overload level, and the volume control set to –10dB. The highest-level distortion harmonics are the third at –70dB (0.03%) and the fifth at –79dB (0.01%). Note, however, that there are many discrete tones in the noisefloor, presumably due to interference from the switch-mode power supply and/or the class-D output modules. However, the highest in level of these is at a still-low –83dB, and the higher-frequency spuriae are increasingly suppressed by the RIAA EQ.
Footnote 1: This has been the case with almost all the integrated amplifiers with digital inputs that I have measured. I am beginning to suspect that is a deliberate decision on the part of the designer so that the volume control will be set lower than with analog sources in order to reduce the level of digital-domain artefacts.