I used DRA Labs' MLSSA system and a calibrated DPA 4006 microphone to measure the Emotiva Airmotiv T2's frequency response in the farfield, and an Earthworks QTC-40 microphone for the nearfield responses. Emotiva specifies the Airmotiv T2's sensitivity as a very high 91dB/2.83V/m; my estimate was within experimental error of that number, at 90.3dB(B)/2.83V/m. Props to Emotiva for an honest high-sensitivity spec, even if they incorrectly refer to it as "efficiency" in the speaker's manual. The Airmotiv T2's impedance is specified as 4 ohms. Fig.1 shows that the T2's impedance magnitude does average close to 4 ohms, though the minimum value is 2.85 ohms at 112Hz, and there is an amplifier-taxing combination of 4 ohms and –53° electrical phase angle at 78Hz. The Airmotiv T2 will need to be used with an amplifier comfortable driving low impedances.
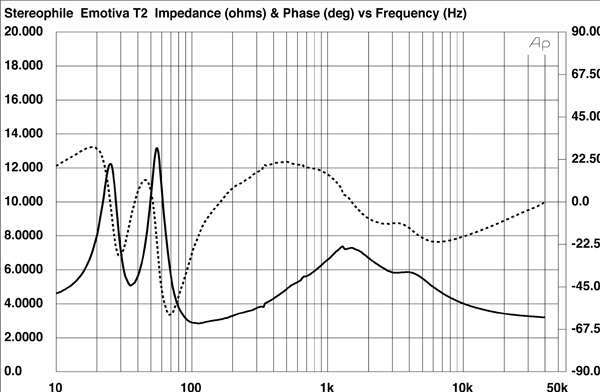
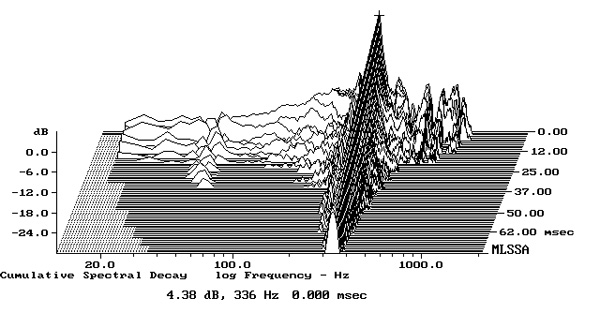
There are a couple of small discontinuities in the impedance traces, the strongest lying between 300 and 400Hz. When I investigated the enclosure's vibrational behavior with a plastic-tape accelerometer, I found a strong resonant mode at 336Hz that was present on all surfaces. Fig.2 shows a cumulative spectral-decay plot calculated from the accelerometer's output when it was fastened to one of the sidewalls level with the midrange drive-unit. Though this mode had a high Q (Quality factor), which will work against its being excited, it is sufficiently low in frequency that I would have thought it might give rise to some midrange coloration. I note that Tom Norton commented on Howe Gelb's voice sounding "a bit thickened."
The impedance-magnitude trace centers on 36Hz, which suggests that this is the two woofers' reflex tuning frequency. When measured in the nearfield, the woofers, which behaved identically, had the expected minimum-motion notch in their outputs at 36Hz (fig.3, blue trace). (At this frequency, the cones are held stationary by the back pressure from the port resonance.) The port's output (red trace) peaks a little lower in frequency, and while its upper-frequency rolloff is disturbed by a couple of resonant modes, these are more than 20dB down compared with the woofer's level. Their audibility will be further reduced by the fact that the port fires to the speaker's rear. Higher in frequency in fig.3, the woofers (blue trace) are crossed over to the midrange unit (green) at about 340Hz, though the latter extends lower in frequency than I would have expected, not starting its ultimate high-order, high-pass rolloff until below 200Hz.
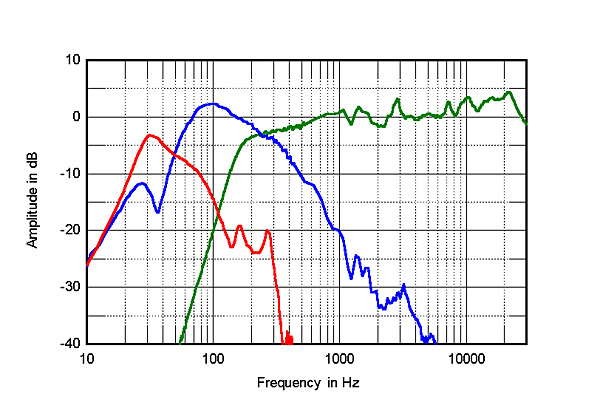
Higher in frequency in fig.3, the green trace shows the output of the T2's midrange unit and tweeter on the tweeter axis. The response is basically evenly balanced, though a sharply defined peak can be seen just below 3kHz, with another at 7kHz, and there is a slight rising trend in the top audio octave. These factors can also be seen in fig.4, the black trace above 300Hz showing the Airmotiv T2's farfield response averaged across a 30° horizontal window centered on the tweeter axis.
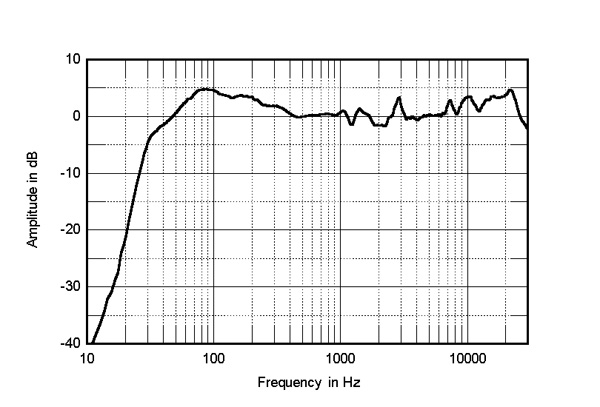
The black trace below 300Hz in fig.4 shows the complex sum of the nearfield midrange, woofer, and port responses, taking into account acoustic phase and the different distances of each radiator from a nominal farfield microphone position. Because the nearfield measurement technique assumes that the drive-unit is mounted in a true infinite baffle—ie, one that extends to infinity in both the vertical and horizontal planes—this results in a peak in the upper bass with a speaker that is actually maximally flat in the bass. Taking this bass peak into account, the Emotiva's woofer tuning appears to be maximally flat, with the low-frequency –6dB point lying at the port tuning frequency. I'm little puzzled, therefore, why TJN found the T2's low frequencies to occasionally sound a little lightweight, especially as the port is placed close to the floor and will benefit from some boundary reinforcement.
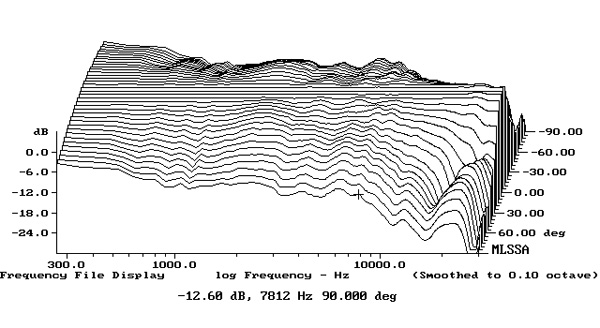
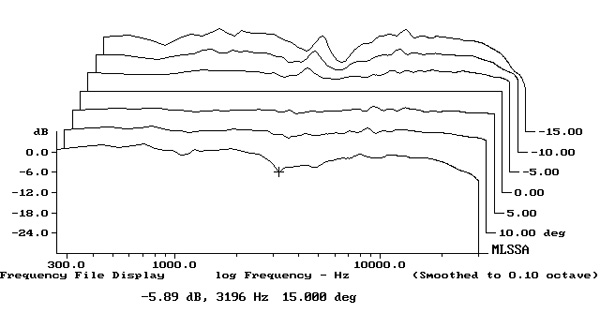
The plot of the Airmotiv T2's horizontal dispersion (fig.5) indicates a well-controlled radiation pattern. The evenly spaced contour lines in this graph suggest that a pair of these speakers will offer stable stereo imaging, due to the fact that their direct sound and the reflections of that sound from the room's sidewalls will not have different characters. However, the Airmotiv tweeter becomes relatively directional above 8kHz, which, in a typical room, will balance the rising top-octave output noted earlier. In the vertical plane (fig.6), the Airmotiv T2's balance doesn't change appreciably over a wide (+5/–10°) window centered on the tweeter axis, which is 38" above the floor.
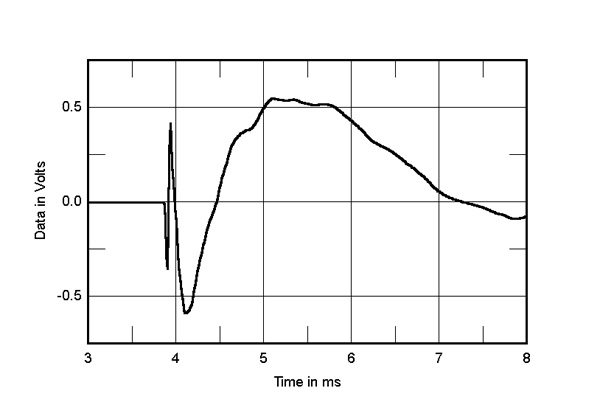
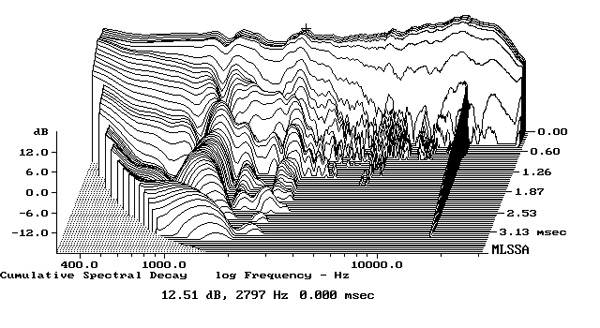
In the time domain, the Airmotiv T2's step response (fig.7) indicates that the tweeter and midrange are connected in negative acoustic polarity, the woofers in positive polarity. The decay of the tweeter's step blends smoothly with the start of the midrange unit's step, and the decay of the latter's step blends smoothly with the start of the woofers' step, suggesting optimal crossover design. The Emotiva's cumulative spectral-decay plot (fig.8) was superbly clean in the treble, but that on-axis peak just below 3kHz is associated with a ridge of delayed energy.
Writing up these measurements, it was easy to forget that the Emotiva Airmotiv T2 is an affordable speaker. Yes, there are a couple of measured problems, but these should be put in context: This speaker costs a dollar short of $1000/pair.—John Atkinson