| Columns Retired Columns & Blogs |
Wilson Audio WATT/Puppy System 5 loudspeaker Measurements part 2
Vertically (fig.6), major middle-treble suckouts appear in the speaker's balance once you sit above the tweeter axis or below the woofer dustcap. Wes did find that he needed to sit with his ears in this region to get the best balance. As noted above, however, with normal seating, placing the WATT on the Puppy results in just the right listening height. Fig.6 also shows that there is too much top-octave energy above the tweeter axis. Do not listen to the WATT/Puppy standing up!!!
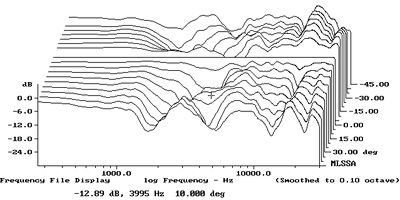
Fig.6 Wilson WATT 5, vertical response family at 57", normalized to response on optimal axis, from back to front: differences in response 45 degrees-5 degrees above optimal axis; reference response; differences in response 5 degrees-45 degrees below optimal axis.
The sheer mass of the Watt/Puppy combination made it impractical to measure its overall response, which is why I have so far concentrated on the WATT by itself. Fig.7 shows the nearfield responses of the Puppy. The trace labeled "W" is the woofer, showing the expected notch in its output at the nominal port tuning frequency. The port output labeled "P," however, peaks almost an octave lower, though it does produce a broad output shelf through the midbass. The complex sum of the two outputs, taking both phase and the physical distance between the port and woofer into account, is shown in fig.7 as the trace labeled "CS." It shows that the Puppy produces a bandpass output centered on the octave region between 120Hz and 60Hz. Its quasi-anechoic response is down 6dB at 46Hz; this will be extended somewhat in-room.
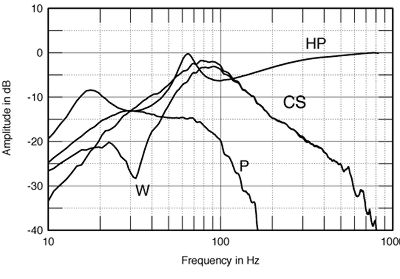
Fig.7 Wilson Puppy 5, nearfield responses of woofers (W), port (P), and their complex sum (CS), with high-pass drive signal to WATT (HP).
The final trace in fig.7, labeled "HP," is the electrical drive to the WATT, measured at the satellite's speaker terminals when connected to the Puppy with the Puppy Tails. Though the drive signal is gently sloped down below 750Hz or so, the high bass-region peaks in the WATT's impedance result in a drive signal that reaches full level between 60Hz and 70Hz. The WATT's output will therefore significantly overlap that of the Puppy, which could contribute to the system's midbass "blump," as Sam Tellig named it. But remember that with an amplifier having a significant output impedance, the overall energy will be pulled down in this same region by the voltage-divider interaction between the speaker and amplifier impedances. The system will therefore sound evenly balanced in this region, which is what WP found with his chosen amplifiers.
In the time domain, the WATT 5's impulse response is shown in fig.8. Although it's hard to see at this size, the response starts with a relatively slow-risetime, negative-going motion, which is then broken by a sharp, positive-going spike from the tweeter. The tweeter's output, however, features a much larger negative-going overshoot. This is clearer in the step response (fig.9), which, apart from the short positive energy spike from the tweeter, features an excellent—if inverted—triangle shape. The Puppy's step response (fig.10), however, indicates that it is connected with positive polarity.
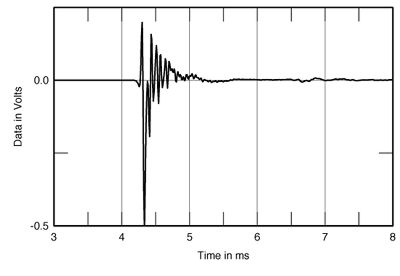
Fig.8 Wilson WATT 5, impulse response on optimal axis at 57" (5ms time window, 30kHz bandwidth).
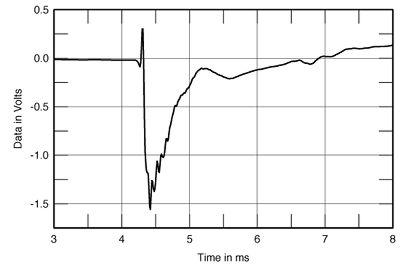
Fig.9 Wilson WATT 5, step response on optimal axis at 57" (5ms time window, 30kHz bandwidth).
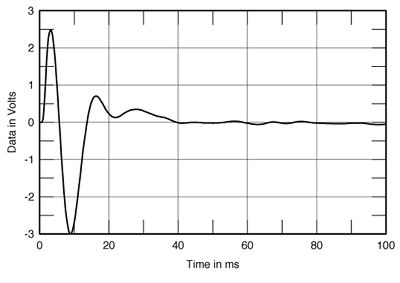
Fig.10 Wilson Puppy 5, overall calculated step response in nearfield (100ms time window, 30kHz bandwidth).
Finally, the WATT's waterfall, or cumulative spectral-decay, plot (fig.11) reveals a very clean initial decay across the band, other than shortlived ridges associated with the two high-frequency tweeter resonances mentioned earlier. This is excellent performance, correlating with the System 5's grain-free and smooth—but detailed—presentation.—John Atkinson

Fig.11 Wilson WATT 5, cumulative spectral-decay plot at 57" (0.15ms risetime).
- Log in or register to post comments

