| Columns Retired Columns & Blogs |
Wilson Audio Specialties MAXX Series 3 loudspeaker Measurements
Sidebar 3: Measurements
As with the MAXX Series 2, the MAXX 3's bulk made transporting one of them to my place for measurement impractical. I therefore measured the MAXX 3 in Michael Fremer's driveway, where I could get the speaker well away from boundaries other than the ground. I did three complete sets of acoustic measurements: at my usual distance of 50" on an axis corresponding to the line of sight from Michael's ears to the speaker, with the upper-frequency array as set up in his listening room; on the same axis at 100", close to the distance from his ears to the speaker in his room; and at 72" on an axis 46" from the floor, with the upper-frequency array set up as recommended by David Wilson for that axis. Because the speaker could not be raised off the floor, simple trigonometry dictated that the farther away the microphone, the less accurate the measured response in the midrange. Because of the three different mike positions, I still hoped to be able to accurately characterize the MAXX 3's behavior. David Wilson had also kindly supplied a set of measurements of the review sample of the MAXX 3 measured under various set-up conditions.
At an estimated 89.6dB(B)/2.83V/m, the MAXX 3 has the same sensitivity as the MAXX Series 2, and is within experimental error of the specified 90dB. The impedance (fig.1) is broadly similar to that of the MAXX 2; however, with a minimum value of 3.4 rather than 2.25 ohms, and a less extreme electrical phase angle, the MAXX 3 will be significantly easier to drive.
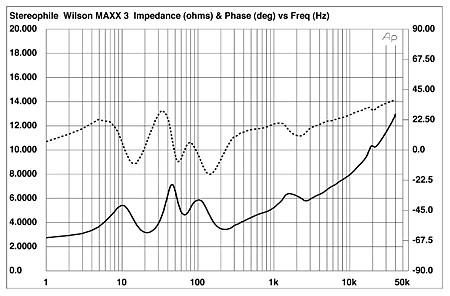
Fig.1 Wilson Audio Specialties MAXX 3, electrical impedance (solid) and phase (dashed). (5 ohms/vertical div.)
The traces in fig.1 are free from the wrinkles that result from resonant modes in the enclosure panels, and I could find no trace of such resonances in the walls of either the woofer bin or the head unit. The small discontinuity in the impedance traces at 20kHz suggests that the tweeter's dome resonance lies at a lower frequency than is usual for a metal-diaphragm unit.
I extended the horizontal axis of the impedance graph to 1Hz to fully reveal the tuning of the woofer bin's 5"-diameter port; ie, the saddle in the magnitude trace between the two lowest-frequency peaks. The port's acoustic output is shown as the green trace in fig.2; it broadly peaks in the two octaves between 15 and 60Hz, and while there is a small peak in its response at 420Hz, this is well down in level and will be further suppressed by the fact that the port faces away from the listener. The red trace in this graph shows the sum of the two woofers' outputs. As expected, the minimum-motion notch in their outputs occurs at the port's tuning frequency of 26Hz, and the response falls off smoothly above the midbass. The blue trace shows the summed outputs of the two midrange units' outputs, which behaved very similarly.
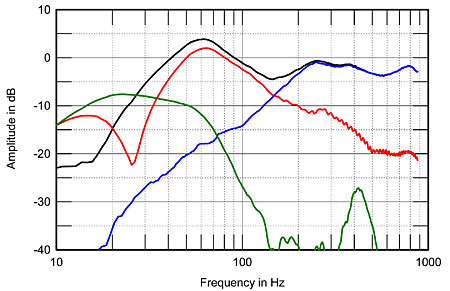
Fig.2 Wilson Audio Specialties MAXX 3, nearfield responses of the midrange units (blue), woofers (red), bass port (green), plotted in the ratio of the square roots of the radiating areas, and their complex sum, allowing for acoustic phase and the different distances from the nominal farfield microphone position (black).
The black trace in fig.2 is the overall sum of the lower-frequency drive-units, taking into account both acoustic phase and the different distances from a nominal farfield microphone position. This trace is repeated to the left of fig.3. While there is a broad boost in the mid- and upper bass in this graph, this is primarily due to the nearfield measurement technique; the MAXX 3's low-frequency output extends down to 30Hz or so, below which it rolls off with the usual 24dB/octave slope of a reflex alignment. To the right of fig.3 is shown the speaker's farfield response, averaged across a 30° horizontal window, taken on the axis recommended by David Wilson and with the upper-frequency array's physical alignment set up for that axis, which was basically level with the center of the lower of the midrange units. This graph was basically the same as that supplied by David Wilson. Both the midrange and the treble are basically flat, but there is a slight downward step at the intersection of these regions. There is also a small excess of energy evident in the mid-treble, but overall, the MAXX 3's balance is smoother and more even than the MAXX 2's.
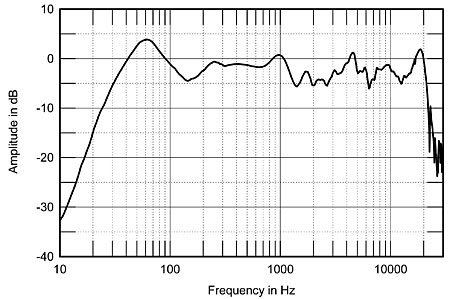
Fig.3 Wilson Audio Specialties MAXX 3, anechoic response on lower-midrange axis at 72", averaged across 30° horizontal window and corrected for microphone response, with complex sum of nearfield midrange, woofer, and port responses plotted below 300Hz.
While the responses taken with the MAXX 3 set up for Michael's listening position differed in the fine detail, they weren't substantively different from the response shown in fig.3, so I haven't reproduced them here. What they do suggest is that the adjustable geometry of the MAXX 3's upper-frequency array does allow the speaker's behavior to be optimized for different listening positions and distances, as long as that distance is not too much closer than the 100" at which Michael sits.
The Wilson's balance does depend on the height of the listener's ears: fig.4 indicates that the slight lack of energy between 1 and 4kHz tends to fill in below the optimal axis. Fig.5 shows how the MAXX 3's response changes to its side. Again, the lack of energy in the low treble tends to fill in off axis, and the MAXX 3's spatially averaged response at the listening position in Mikey's room is impressively flat and even from the middle of the midrange up (fig.6). The MAXX 3's in-room behavior is more uniform in the treble than the 2's (fig.6 in that review), though the different analyzer and graphing technique make that a little difficult to see. The peaks just above 300Hz and in the midbass, as well as the depression between 100 and 200Hz, are residual room effects that have not been minimized by the spatial averaging used to generate this graph. (I derived this graph by averaging 20 measurements taken for each speaker in a rectangular grid measuring 36" by 18" and centered on the position of MF's ears in his listening chair. I used an Earthworks omni microphone and a Metric Halo ULN-2 FireWire audio interface, in conjunction with SMUGSoftware's Fuzzmeasure 2.0 running on my Apple laptop.) In this respect, the behaviors of the MAXX 3 and 2 are very similar.
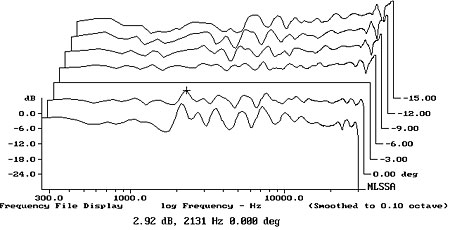
Fig.4 Wilson Audio Specialties MAXX 3, vertical response family at 50", normalized to response on lower-midrange axis, from back to front: differences in response 20–5° above axis, reference response, differences in response 5–10° below axis.

Fig.5 Wilson Audio Specialties MAXX 3, lateral response family at 50", normalized to response on lower-midrange axis, from back to front: differences in response 90–5° off axis, reference response, differences in response 5–90° off axis.

Fig.6 Wilson Audio Specialties MAXX 3, spatially averaged, 1/6-octave response in MF's listening room.
Turning to the time domain, the MAXX 3's step response (fig.7) on the axis recommended by David Wilson is very similar to the MAXX 2's. The tweeter (the sharp up-down spike at 5.5ms) is connected in positive acoustic polarity, and the negative-going overshoot of its step smoothly blends into the step output of the midrange units, which are connected in inverted acoustic polarity. Their step in turn smoothly blends into the slower, later, positive-going arrival of the woofers' output. This good time-domain integration suggests equally good integration of the drive-units' outputs through the crossover regions in the frequency domain.
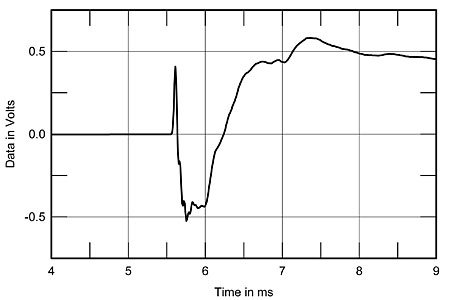
Fig.7 Wilson Audio Specialties MAXX 3, step response on lower-midrange axis at 50" (5ms time window, 30kHz bandwidth).
Finally, the MAXX 3's cumulative spectral-decay plot on the optimal axis (fig.8) was significantly better than the 2's, with a much cleaner initial decay, though there is still some delayed energy evident in the low treble.
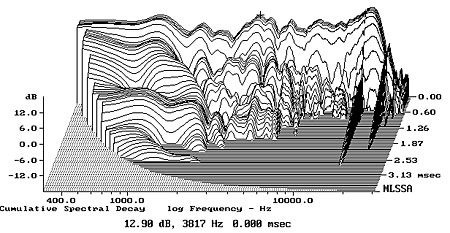
Fig.8 Wilson Audio Specialties MAXX 3, cumulative spectral-decay plot on lower-midrange axis at 50" (0.15ms risetime).
I don't measure harmonic or intermodulation distortion for loudspeakers because it is difficult to obtain consistently meaningful results without access to a large anechoic chamber. But one aspect of the MAXX 3's sound that I did notice in my own auditioning was its superb linearity at low frequencies. Couple that to the expansiveness yet solidity of its soundstage, and you will comprehend why I felt these Wilsons produced the best sound overall that I have experienced in Michael's room.—John Atkinson
- Log in or register to post comments
