To examine the performance of the S6 Black Edition's digital inputs, I used the coaxial and optical S/PDIF inputs—the optical input only accepted data sampled at rates up to 96kHz—and USB data sourced from my MacBook Pro. The USB Prober utility identified the S6 Black Edition as "UNISON USB DAC 2" from "UNISON RESEARCH," with the serial number string "0 (none)," and indicated that the USB port operated in the optimal isochronous asynchronous mode. Apple's AudioMIDI utility showed that the Unison Research accepted 16-bit and 32-bit integer data via USB sampled at all rates from 44.1kHz to 384kHz.
The Unison Research's digital inputs preserved absolute polarity from both output types. With the volume control set to the maximum, the output level with a 1kHz tone at a low –30dBFS was 132.8mV from the Subwoofer output and 3.96V from the speaker output into 8 ohms. The latter is 13dB below the clipping voltage into that load; the S6 Black Edition's DAC offers 17dB higher gain than is strictly necessary. To avoid overloading the amplifier's output stage, I performed all the subsequent digital input testing at the Subwoofer output with the volume control set to –20dB.
With its analog inputs Unison Research's S6 Black Edition behaved pretty much as I would expect from a tube amplifier with a single-ended output stage and little or no global negative feedback. While the distortion signature is predominantly the innocuous second harmonic, the high levels of distortion at powers of more than 1W, especially into impedances below 8 ohms, mean that this amplifier must be used with loudspeakers that have both a high sensitivity and a high impedance. Measured via the subwoofer output, the measured performance of the digital inputs was compromised by the presence of the supply-related spuriae.—John Atkinson
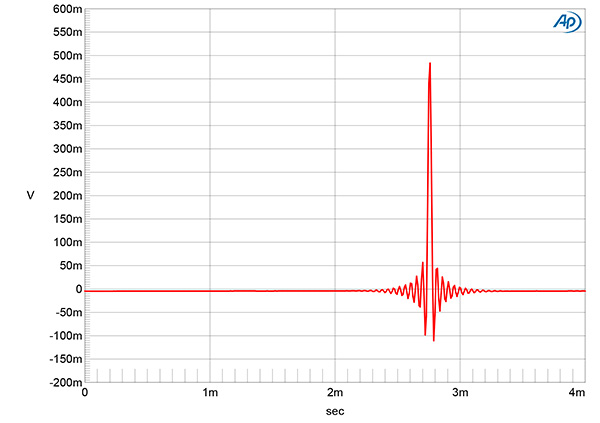
Fig.10 Unison Research S6 Black Edition, digital inputs, impulse response (one sample at 0dBFS, 44.1kHz sampling, 4ms time window).
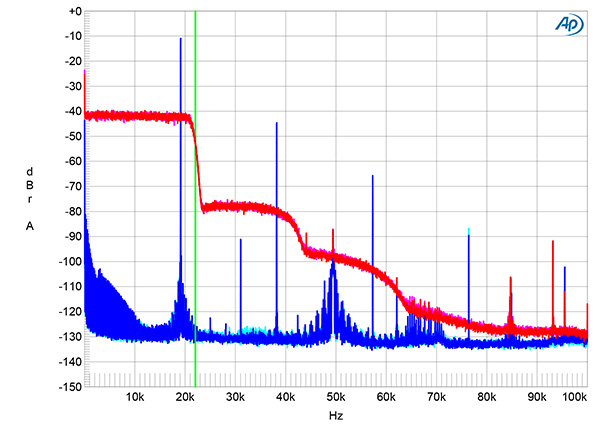
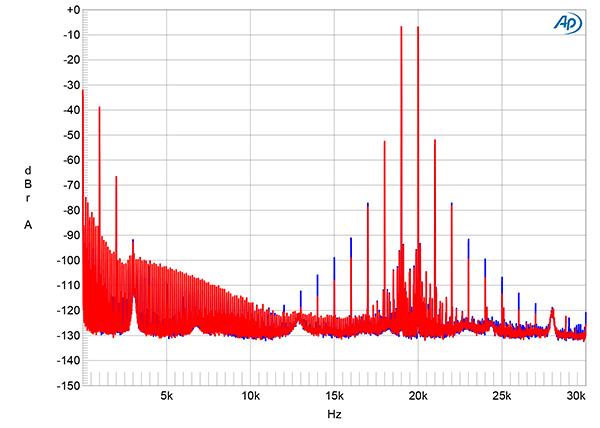
Fig.11 Unison Research S6 Black Edition, digital inputs, wideband spectrum of white noise at –4dBFS (left channel red, right magenta) and 19.1kHz tone at -10dBFS (left blue, right cyan) with data sampled at 44.1kHz (20dB/vertical div.).
The Unison Research S6 Black Edition offers a single reconstruction filter for PCM data. Fig.10 shows the filter's impulse response with 44.1kHz data and indicates that the filter is a linear-phase type with equal amounts of ringing before and after the single high sample. The magenta and red traces in fig.11 show the filter's ultrasonic rolloff with data sampled at 44.1kHz. This is interrupted at 24kHz by a rise in level of the ultrasonic noisefloor, which might be related to the high levels of distortion. The response doesn't reach full stop-band attenuation until twice the sample rate. The aliased image at 25kHz of a 19.1kHz tone at –100dBFS (cyan, blue) is fully suppressed, but the harmonics associated with the 19.1kHz tone are all relatively high in level. The second harmonic is the highest in level, at –44dB (0.6%).
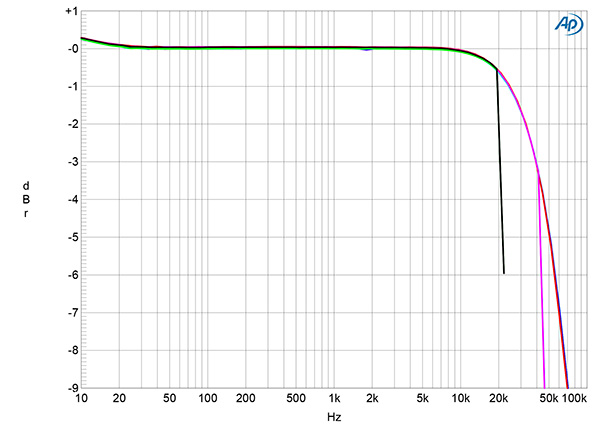
Fig.12 Unison Research S6 Black Edition, digital inputs, frequency response at –12dBFS with data sampled at: 44.1kHz (left channel green, right gray), 96kHz (left cyan, right magenta), and 192kHz (left blue, right red) (1dB/vertical div.).
Fig.12 shows the frequency response with data sampled at 44.1kHz, 96kHz, and 192kHz. The audioband response is very similar to that of the analog inputs with all three sample rates, with then a sharp rolloff just below half of each sample rate.
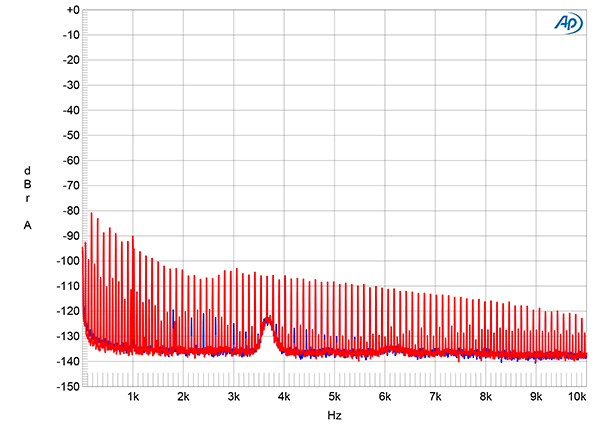
Fig.13 Unison Research S6 Black Edition, digital inputs, spectrum with noise and spuriae of dithered 1kHz tone at –90dBFS with 24-bit data (left blue, right red) (20dB/vertical div.).
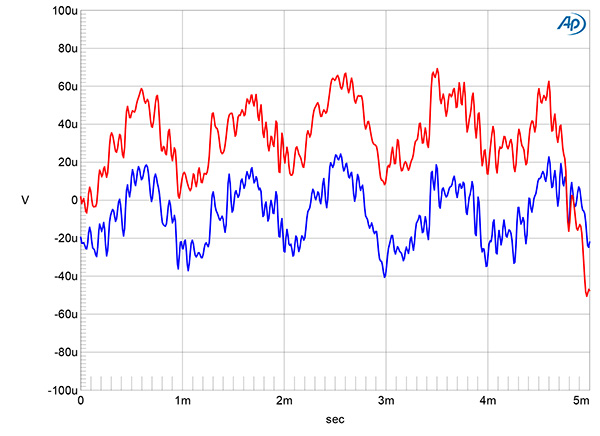
Fig.14 Unison Research S6 Black Edition, digital inputs, waveform of undithered 1kHz sinewave at –90.31dBFS, 16-bit data (left channel blue, right red).
While the level of a dithered 24-bit 1kHz tone at –90dBFS was correct (fig.13), the noisefloor was dominated by the power supply-related spuriae seen in the loudspeaker outputs. This suggests that the Subwoofer output might be taken after the tubed output stage. With undithered data representing a tone at exactly –90.31dBFS, the three DC voltage levels described by the data were obscured by noise (fig.14).
Fig.15 Unison Research S6 Black Edition, digital inputs, HF intermodulation spectrum, DC–30kHz, 19+20kHz at –6dBFS, 24-bit/44.1kHz data (left channel blue, right red; linear frequency scale).
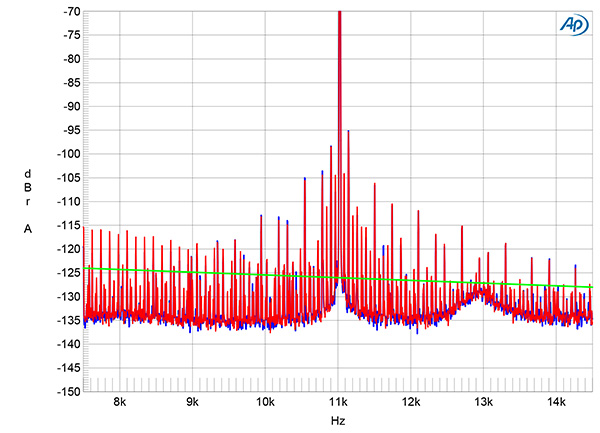
Fig.16 Unison Research S6 Black Edition, Toslink input, high-resolution jitter spectrum of analog output signal, 11.025kHz at –6dBFS, sampled at 44.1kHz with LSB toggled at 229Hz: 16-bit data (left channel blue, right red). Center frequency of trace, 11.025kHz; frequency range, ±3.5kHz.
With an equal mix of 19 and 20kHz tones, each at –6dBFS, the second-order intermodulation product at 1kHz and the higher-order products were slightly higher than they had been with the analog inputs, and again the noisefloor is obscured by the supply-related spuriae (fig.15). These spuriae also affected my attempt to examine the S6 Black Edition's rejection of word-clock jitter, obscuring the levels of the odd-order harmonics of the undithered low-frequency, LSB-level squarewave (fig.16).