Sidebar 3: Measurements
I performed a full set of measurements on the Unison Research S6 Black Edition using my Audio Precision SYS2722 system. I carefully installed the tubes and after leaving the amplifier powered up for 30 minutes, checked that the bias for each of the six KT77 output tubes was correctly set. I rechecked the bias every 30 minutes during the testing.
Looking first at the S6 Black Edition's unbalanced line inputs, the input impedance measured 39k ohms at 20Hz and 1kHz and 36k ohms at 20kHz. The amplifier inverted absolute polarity at both the loudspeaker and subwoofer outputs. (The "Phase" button on the remote control is for Unison source components.) With the volume control set to the maximum, the voltage gain at 1kHz from the loudspeaker outputs into 8 ohms was 35dB.
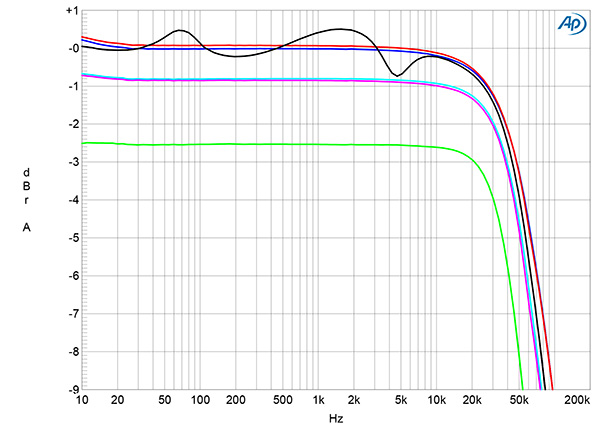
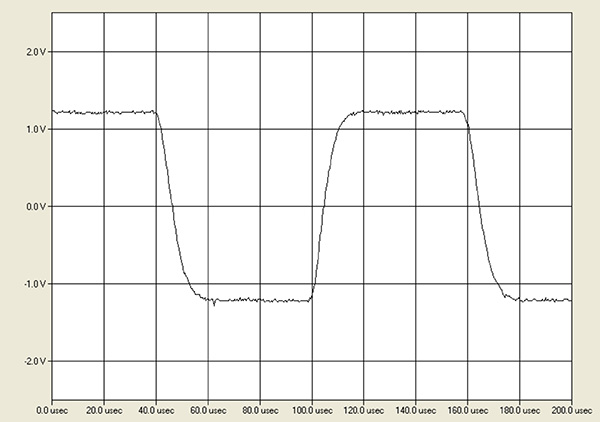
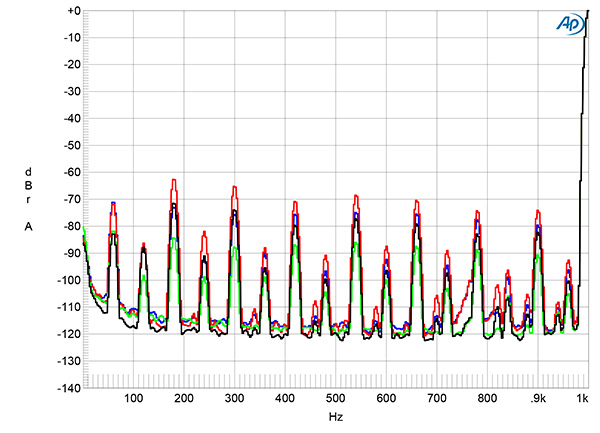
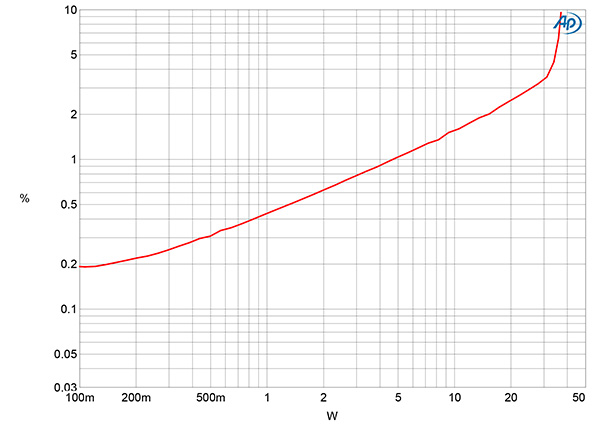
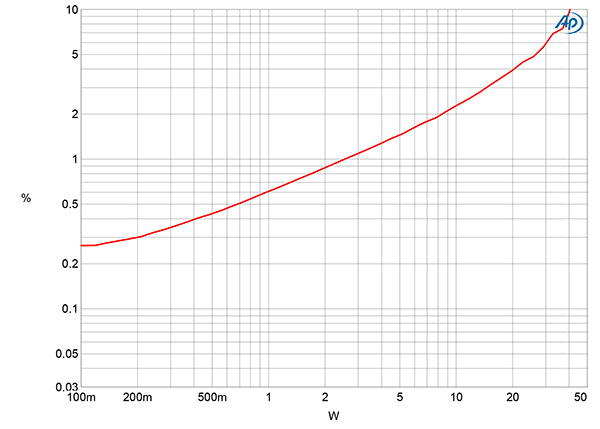
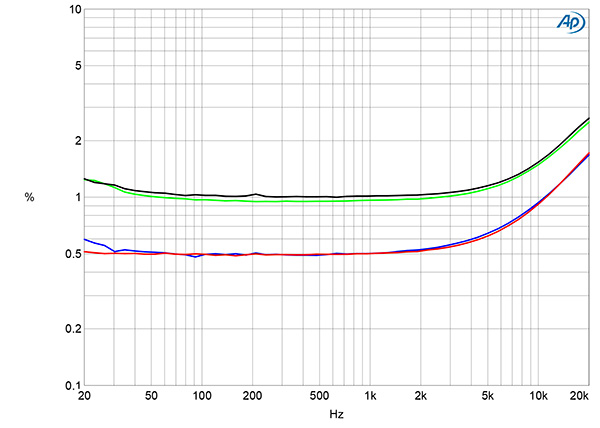
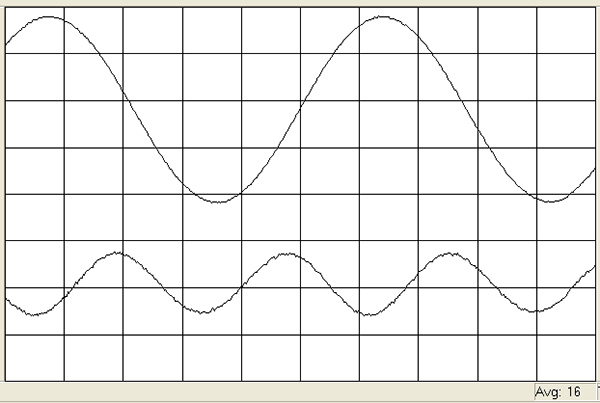
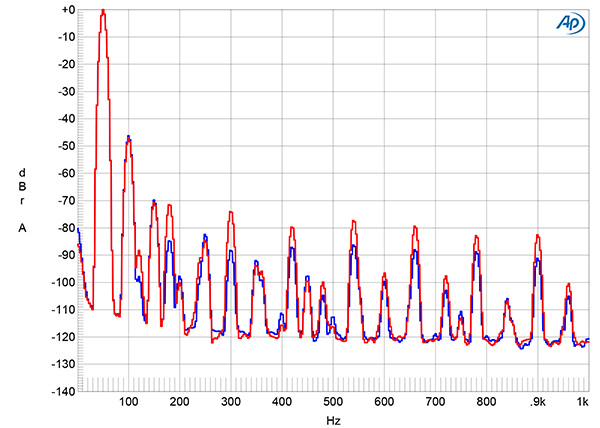
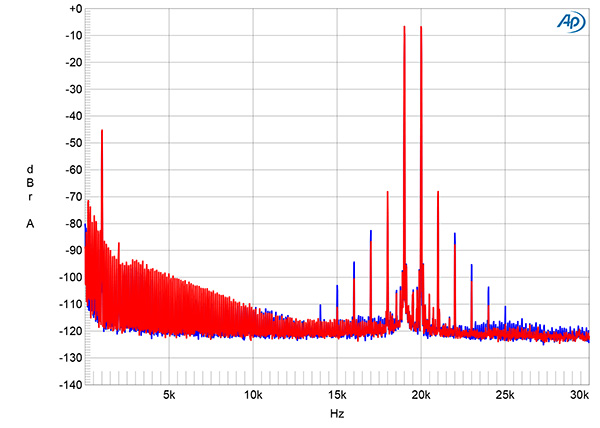
Fig.1 Unison Research S6 Black Edition, line input, frequency response at 2.83V into: simulated loudspeaker load (gray), 8 ohms (left channel blue, right red), 4 ohms (left cyan, right magenta), 2 ohms (green) (1dB/vertical div.).
Fig.2 Unison Research S6 Black Edition, line input, small-signal, 10kHz squarewave into 8 ohms.
The Subwoofer output impedance was 95 ohms at all audio frequencies. The loudspeaker output impedance was low for a single-ended tubed design, at 0.8 ohm at 20Hz and 1kHz, 0.6 ohm at 20kHz. Presumably this is because the three output tubes are wired in parallel. The modulation of the S6 Black Edition's frequency response due to the Ohm's law interaction between this impedance and the impedance of our standard simulated loudspeaker is a moderate ±0.65dB (fig.1, gray trace). The amplifier's response into resistive loads is flat up to 10kHz, with its output into 8 ohms (blue and red traces) down by 3dB at 40kHz. Both the very close channel balance and the overall response were preserved at lower settings of the volume control. The S6 Black Edition's reproduction of a 10kHz squarewave (fig.2) was free from overshoot or ringing.
Fig.3 Unison Research S6 Black Edition, line input, spectrum of 1kHz sinewave, DC–1kHz, at 1Wpc into 8 ohms with volume control set to the maximum (left channel blue, right red), and to –20dB (left green, right gray) (linear frequency scale).
Channel separation was moderate, at 60dB in both directions across the audioband. (I looked at each undriven channel's output on an oscilloscope to make sure the measurement was dominated by actual crosstalk rather than noise.) The wideband, unweighted signal/noise ratio, taken with the input shorted to ground and the volume control set to its maximum, was an okay 65.4dB in the left channel, but 58.6dB in the right, both ref. 2.83V, which is equivalent to 1W into 8 ohms. These ratios were the same when the measurement bandwidth was restricted to the audioband, but improved to 68.5dB and 63.2dB, respectively, when A-weighted. The blue and red traces in fig.3 show the S6 Black Edition's low-frequency noisefloor at 1Wpc into 8 ohms with the volume control set to its maximum; the green and gray traces show the noisefloor spectrum at the control set to –20dB and with the input signal increased by the same 20dB so that the output level remains at 2.83V. The levels of the random noise components are similar with both volume control settings, but the power supply–related spuriae are lowered by a few dB at the control's –20dB setting. These spuriae are predominantly 60Hz and its odd-order harmonics, which suggests that they are due to magnetic interference from the power transformer.
Fig.4 Unison Research S6 Black Edition, line input, THD+N (%) vs 1kHz continuous output power into 8 ohms.
Fig.5 Unison Research S6 Black Edition, line input, THD+N (%) vs 1kHz continuous output power into 4 ohms.
Unison Research specifies the S6 Black Edition's maximum power as 40W into 6 ohms, which is equivalent to 14.75dBW, indicating that this is specified at 5% THD+N. Fig.4 plots how the THD+noise percentage in the amplifier's output varies with power into 8 ohms with both channels driven. At our usual definition of clipping, which is when THD+N reaches 1%, the S6 Black Edition clipped at just 4.7W (6.72dBW). Relaxing the definition to 3% THD+N gave 26W into 8 ohms (14.15dBW) and to 10% gave 38W into 8 ohms (15.8dBW). Unison Research doesn't specify the maximum power into 4 ohms. Fig.5 was taken with both channels driven into 4 ohms; at 10% THD+N the amplifier delivers 41Wpc (13dBW) but the distortion rises above 1% above 3W into this load. The upward slope in figs.4 & 5 indicates that the circuit has little or no global negative feedback.
Fig.6 Unison Research S6 Black Edition, line input, THD+N (%) vs frequency at 2.83V into: 8 ohms (left channel blue, right red), 4 ohms (left green, right gray).
The higher level of distortion into 4 ohms can also be seen in fig.6, which shows how the S6 Black Edition's THD+N percentage changed with frequency at 2.83V, which is equivalent to 1W into 8 ohms and 2W into 4 ohms. The distortion into 8 ohms (blue and red traces) is lower than that to 4 ohms (green and gray traces) but is still relatively high. The THD+N rises in the top two audio octaves into both impedances, which will be due to the limitation in the amplifier's open-loop bandwidth.
ig.7 Unison Research S6 Black Edition, line input, 1kHz waveform at 1W into 8 ohms, 0.5% THD+N (top); distortion and noise waveform with fundamental notched out (bottom, not to scale).
Fig.8 Unison Research S6 Black Edition, line input, spectrum of 50Hz sinewave, DC–10kHz, at 1Wpc into 8 ohms (left channel blue, right red, linear frequency scale).
Fig.9 Unison Research S6 Black Edition, line input, HF intermodulation spectrum, DC–30kHz, 19+20kHz at 1Wpc peak into 8 ohms (left channel blue, right red, linear frequency scale).
The THD+N waveform, taken at 1W into 8 ohms (fig.7), is dominated by the subjectively innocuous second harmonic at 0.5%, which was confirmed by spectral analysis (fig.8). The second-order difference product with an equal mix of 19kHz and 20kHz tones lay at –46dB (0.6%) ref. the peak signal level, though the higher-order products at 18kHz and 21kHz were lower in level, at –69dB (0.03%). (The volume control was set to –20dB for the spectra shown in figs.8 & 9 in order to lower the levels of the supply-related spuriae.)—John Atkinson