Sidebar 3: Measurements
I used DRA Labs' MLSSA system and a calibrated DPA 4006 microphone with an Earthworks microphone preamplifier to measure the Stenheim Alumine Two.Five's farfield frequency behavior and dispersion. I used an Earthworks QTC-40 mike for the nearfield and in-room responses and Dayton Audio's DATS V2 system to measure the impedance magnitude and electrical phase angle. The loudspeaker was too heavy for me to carry up the stairs to the large room where I usually perform speaker measurements, so I measured one of the Alumine Two.Fives in my basement listening room. Although I could lift the speaker onto a small stack of 2×4s sitting on top of a dolly, the first reflection from the ground still occurred earlier than is usually the case with my testing. I therefore measured the response and dispersion with the microphone at 1m rather than my usual 50". It wasn't possible to measure the off-axis response more than 60° to each side of the tweeter axis; usually I measure to 90°.
Stenheim specifies the Alumine Two. Five's anechoic sensitivity as 93dB (half-space), which means the measurements were taken with the speaker adjacent to a boundary. My B-weighted estimate, though not a half-space measurement, was close to the specified figure at 92.1dB(B)/2.83V/1m.
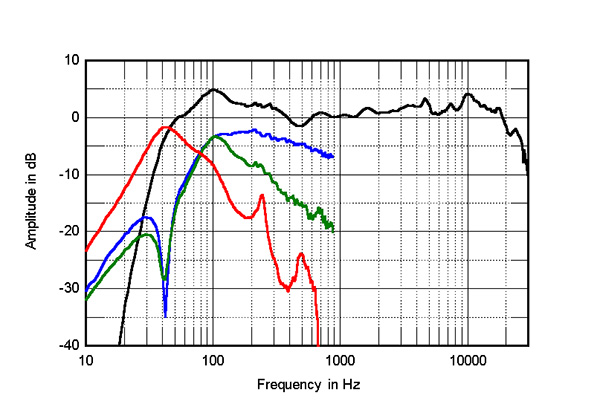
The black trace above 300Hz in fig.3 shows the Alumine Two.Five's quasi-anechoic farfield response, averaged across a 30° horizontal window centered on the tweeter axis. The response is generally smooth and even, though there is a slight lack of energy in the middle of the midrange and a gentle rising trend between 600Hz and 10kHz. The pair matching between the two samples was excellent, meeting ±0.5dB limits between 1kHz and 12kHz and ±1dB limits at lower and higher frequencies.
Footnote 1: EPDR is the resistive load that gives rise to the same peak dissipation in an amplifier's output devices as the loudspeaker. See "Audio Power Amplifiers for Loudspeaker Loads," JAES, Vol.42 No.9, September 1994, and stereophile.com/reference/707heavy/index.html.
Footnote 2: This means that the loudspeaker is firing into hemispherical space rather than a full sphere. A speaker that has a truly flat response in the usual "4pi" space will therefore appear to have a boosted upper-bass output with a nearfield measurement, the center frequency of that boost depending on the physical dimensions of the speaker and the woofer alignment. See this discussion or aes2.org/publications/elibrary-page/?id=7171.
Footnote 3: Using the FuzzMeasure 3.0 program, a Metric Halo MIO2882 FireWire-connected audio interface, and a 96kHz sample rate, I average 20 1/6-octave–smoothed spectra, individually taken for the left and right speakers, in a rectangular grid 36" wide by 18" high and centered on the positions of my ears.
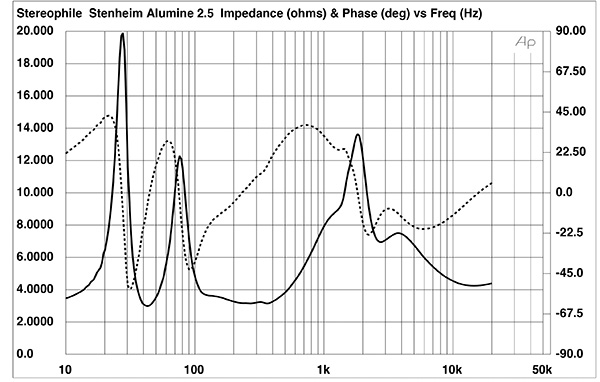
Fig.1 Stenheim Alumine Two.Five, electrical impedance (solid) and phase (dashed) (2 ohms/vertical div.).
The Alumine Two.Five's impedance is specified as 8 ohms. I measured a range of impedance between 4 ohms and 10 ohms over most of the audioband (fig.1, solid trace), with a minimum value of 3.15 ohms at 250Hz. As the electrical phase angle (dashed trace) is occasionally high, the effective resistance, or EPDR (footnote 1) , drops below 3 ohms for several regions between 31Hz and 966Hz and between 6.3kHz and 11kHz. The minimum EPDR values are 1.41 ohms at 37Hz, 1.66 ohms at 107Hz, and 1.57 ohms at 481Hz. The Alumine Two.Five is a current-hungry amplifier load, though this will be ameliorated by its high sensitivity.
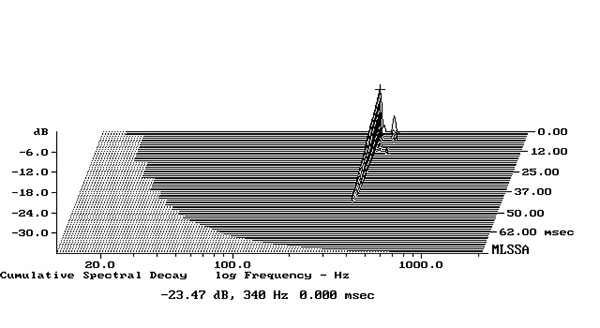
Fig.2 Stenheim Alumine Two.Five, cumulative spectral-decay plot calculated from output of accelerometer fastened to center of sidewall level with the lower woofer (MLS driving voltage to speaker, 7.55V; measurement bandwidth, 2kHz).
Other than a slight discontinuity between 300Hz and 400Hz, the impedance traces in fig.1 are free from the small wrinkles in the midrange that would imply the existence of cabinet resonances. When I rapped the enclosure's walls with my knuckles, I could hear very quiet "plinks." I investigated the enclosure's vibrational behavior with a plastic-tape accelerometer; the only resonant modes I found lay at 340Hz on the sidewalls level with the lower woofer (fig.2), joined by another at 422Hz that was level with the tweeter. These modes are extremely low in level and have a very high Q (Quality Factor), which will work against audible consequences.
The saddle centered at 42Hz in the magnitude trace in fig.1 indicates that this is the tuning frequency of the port on the front baffle, which is very close to the frequency of the lowest note on the four-string bass guitar and double bass. The red trace in fig.3 shows the nearfield response of the port. It reaches its maximum level at the tuning frequency, and the upper-frequency rollout is clean, other than two low-level resonant peaks at 240Hz and 490Hz. The blue trace in fig.3 shows the nearfield response of the upper woofer, the green trace that of the lower woofer. Both have the expected minimum-motion notch at the port-tuning frequency, which is when the back pressure from the port resonance holds the diaphragms stationary. Note however that the lower woofer's output slowly rolls off above 120Hz, and its level is 12dB lower than that of the upper woofer at 875Hz. This confirms that the Alumine Two.Five is indeed a "2.5-way" design, where only the upper woofer's response extends to the frequency of the crossover to the tweeter.
Fig.3 Stenheim Alumine Two.Five, anechoic response on tweeter axis at 1m, averaged across 30° horizontal window and corrected for microphone response, with the nearfield responses of the upper woofer (blue), lower woofer (green), port (red), and the complex sum of the nearfield responses respectively plotted below 875Hz, 875Hz, 680Hz, and 310Hz.
The rise in the midbass of the complex sum of the woofer and port responses (black trace below 310Hz in fig.3) is due to the nearfield measurement technique, which assumes that the drive units are mounted in a true infinite baffle (footnote 2). The Alumine Two.Five's woofer alignment is slightly overdamped, and the low frequencies roll off below 50Hz. As I wrote in the review text, maximizing the Alumine Two. Five's sensitivity inevitably limits the speaker's low-frequency extension. Hofmann's Iron Law strikes again.
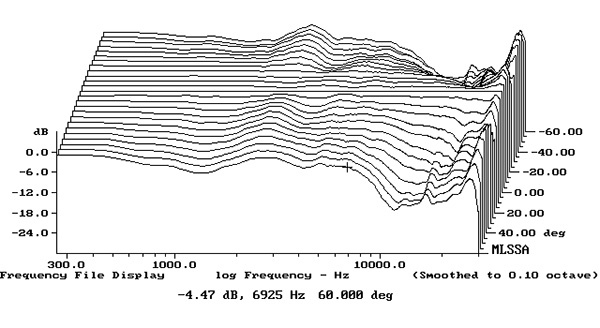
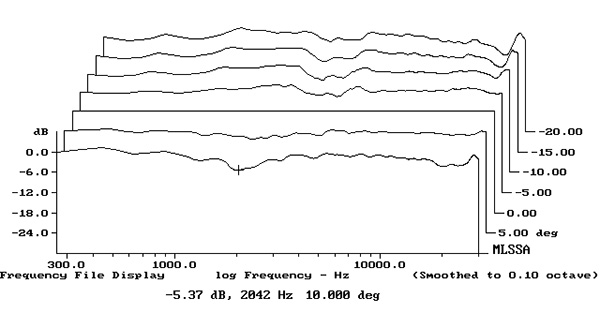
Fig.4 Stenheim Alumine Two.Five, lateral response family at 1m, normalized to response on tweeter axis, from back to front: differences in response 60–5° off axis on port side of baffle, reference response, differences in response 5–60° off axis on tweeter side of baffle.
Fig.5 Stenheim Alumine Two.Five, vertical response family at 1m, normalized to response on tweeter axis, from back to front: differences in response 20–5° above axis, reference response, differences in response 5–10° below axis.
Fig.4 shows the Alumine Two.Five's horizontal dispersion, normalized to the response on the tweeter axis, which thus appears as a straight line. With the asymmetrical placement of the drive units on the front baffle, the dispersion on the driver side of the baffle is shown to the front of this graph, that on the other side to the rear. The radiation pattern is generally even, which correlates with accurate and stable stereo imaging. There is a slight off-axis flare in the presence region, which is probably due to the tweeter's dispersion being wider at the bottom of its passband than the dispersion of the upper woofer at the top of its passband. Note that the dispersion narrows considerably above 10kHz. The Stenheim speaker's radiation pattern in the vertical plane, again normalized to the response on the tweeter axis, which is 34" from the floor with the speaker supported on its spikes, is shown in fig.5. The loudspeaker's response in the audioband doesn't change appreciably over a ±5° angle.
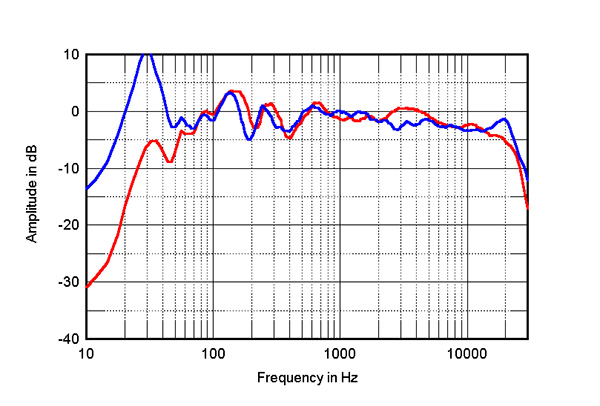
Fig.6 Stenheim Alumine Two.Five, spatially averaged, 1/6-octave response in JA's listening room (red) and of MoFi SourcePoint 888 (blue).
The red trace in fig.6 shows the Stenheim Alumine Two.Fives' spatially averaged response in my listening room with the speakers in the original positions (footnote 3). The spatial averaging hasn't quite eliminated the small peaks and dips between 50Hz and 500Hz, but the in-room response is generally even above that region. The small excess of energy between 2.5kHz and 5kHz is likely due to the off-axis flare in that region shown in fig.4. The slight downward slope in the treble is due both to the increased absorption of the room's furnishings and the speaker's reduced dispersion as the frequency increases. For reference, the blue trace in fig.6 is the spatially averaged response of the MoFi SourcePoint 888, which I reviewed in March 2025. Other than the Stenheim's presence-region boost, the upper-frequency in-room responses of the two speakers are similar, though with their ports open, the 888s maximally excite the lowest-frequency room mode. By contrast, the Alumine Two.Fives' low frequencies shelve down below 80Hz and roll off quickly below 32Hz.
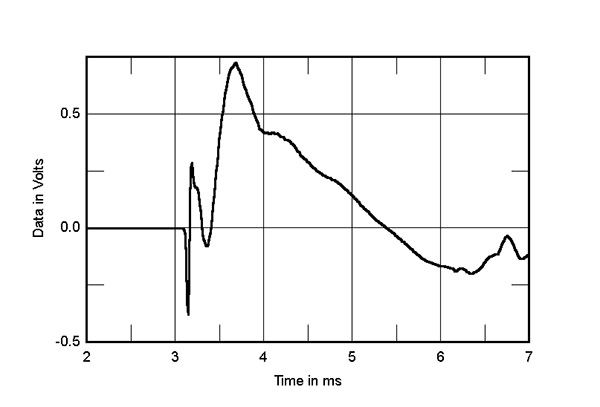
Fig.7 Stenheim Alumine Two.Five, step response on tweeter axis at 1m (5ms time window, 30kHz bandwidth).
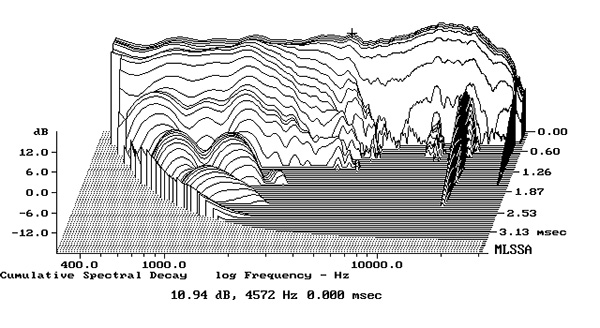
Fig.8 Stenheim Alumine Two.Five, cumulative spectral-decay plot on tweeter axis at 1m (0.15ms risetime).
In the time domain, the Alumine Two. Five's step response (fig.7) indicates that the tweeter is connected in inverted acoustic polarity, the woofers in positive polarity. (Ignore the discontinuity at 6.8ms in the step response, which is due to the first reflection of the woofers' output from the floor.) The tweeter's output arrives first at the microphone, followed around 0.3ms later by that of the woofers. The fact that the acoustic centers of the woofers are farther away than that of the tweeter, coupled with the phase behavior of the crossover filters, means that the tweeter's step has decayed considerably by the start of the woofer's step. Nevertheless, the drive units' steps still blend smoothly, which implies an optimal crossover implementation. The Alumine Two.Five's cumulative spectral-decay plot (fig.8) is very clean overall, though some low-level delayed energy is present at the top of the upper woofer's passband. (As always with my waterfall plots, ignore the ridge of delayed energy close to 16kHz, which is due to interference from the MLSSA host PC's video circuitry.)
Overall, the Stenheim Alumine Two.Five offers respectable measured performance. The high sensitivity will be beneficial if the speaker is used with low-power amplifiers, though they should be capable of driving low impedances. The presence-region balance will require care taken in setup, and the limited dispersion in the top octave will make experimenting with toe-in a useful tool to optimize the balance.—John Atkinson
Footnote 1: EPDR is the resistive load that gives rise to the same peak dissipation in an amplifier's output devices as the loudspeaker. See "Audio Power Amplifiers for Loudspeaker Loads," JAES, Vol.42 No.9, September 1994, and stereophile.com/reference/707heavy/index.html.


