Sidebar 3: Measurements
I used DRA Labs' MLSSA system and a calibrated DPA 4006 microphone with an Earthworks microphone preamplifier to measure the MoFi SourcePoint 888's farfield frequency behavior and dispersion. I used an Earthworks QTC-40 mike for the nearfield and in-room responses and Dayton Audio's DATS V2 system to measure the impedance magnitude and electrical phase angle. I couldn't carry the 96lb loudspeaker up the stairs to the large room where I usually perform speaker measurements, so I measured the SourcePoint 888 in my basement listening room. Although I lifted the speaker onto a small stack of 2×4s sitting on top of a dolly, the first reflection from the ground still occurs earlier than is usually the case with my testing. I therefore measured the response and dispersion with the microphone at 1m rather than my usual 50". It wasn't possible to measure the off-axis response more than 60° to each side of the tweeter axis.
Footnote 1: See EPDR is the resistive load that gives rise to the same peak dissipation in an amplifier's output devices as the loudspeaker. See "Audio Power Amplifiers for Loudspeaker Loads," JAES, Vol.42 No.9, September 1994, and stereophile.com/reference/707heavy/index.html. Footnote 2: This means that the loudspeaker is firing into hemispherical space rather than a full sphere. A speaker that has a truly flat response in the usual "4pi" space will therefore appear to have a boosted upper-bass output with a nearfield measurement, the center frequency of that boost depending on the physical dimensions of the speaker and the woofer alignment. See this discussion.
Footnote 3: Using the FuzzMeasure 3.0 program, a Metric Halo MIO2882 FireWire-connected audio interface, and a 96kHz sample rate, I average 20 1/6-octave–smoothed spectra, individually taken for the left and right speakers, in a rectangular grid 36" wide by 18" high and centered on the positions of my ears.
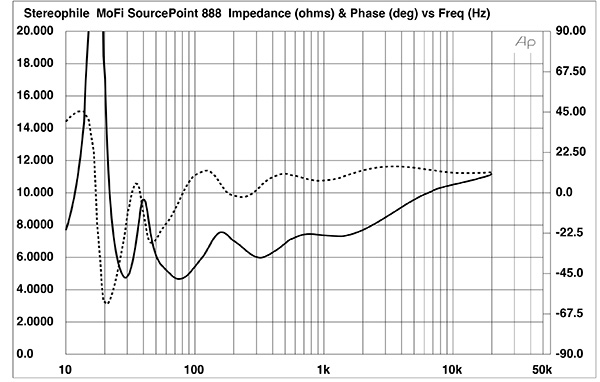
Fig.1 MoFi SourcePoint 888, electrical impedance (solid) and phase (dashed) (2 ohms/vertical div.).
MoFi specifies the SourcePoint 888's anechoic sensitivity as 87dB/2.83V/1m. My B-weighted estimate was slightly lower, at 85.5dB(B)/2.83V/1m. The SourcePoint 888's impedance, specified as 6 ohms with a minimum magnitude of 4.5 ohms, lies between 6 ohms and 10 ohms for most of the audioband (fig.1, solid trace), dropping to 4.75 ohms at 29Hz and 4.67 ohms at 75Hz. Though the electrical phase angle (dashed trace) is mostly low, the effective resistance, or EPDR (footnote 1), drops below 4 ohms between 20Hz and 32Hz, 43Hz and 78Hz, and 87Hz and 124Hz. The minimum EPDR values are 1.9 ohms at 25Hz and 2.75 ohms at 52Hz. However, as music rarely has high energy at these frequencies, the SourcePoint 888 won't be a difficult load for amplifiers. Just make sure your amplification chain has sufficient gain to deal with the 888's lowish sensitivity.
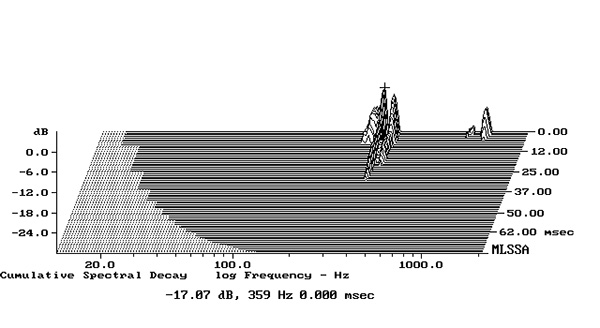
Fig.2 MoFi SourcePoint 888, cumulative spectral-decay plot calculated from output of accelerometer fastened to center of sidewall level with coaxial drive unit (MLS driving voltage to speaker, 7.55V; measurement bandwidth, 2kHz).
The traces in fig.1 are free from the small discontinuities in the midrange that would imply the existence of cabinet resonances of various kinds, and the large enclosure seemed surprisingly inert when I rapped its walls with my knuckles. When I investigated the enclosure's vibrational behavior with a plastic-tape accelerometer, the highest-level resonant modes lay at 359Hz and 410Hz on the sidewalls, level with the coaxial drive unit (fig.2). These modes are very low in level and have a high Q (Quality Factor), which will work against them having audible consequences.
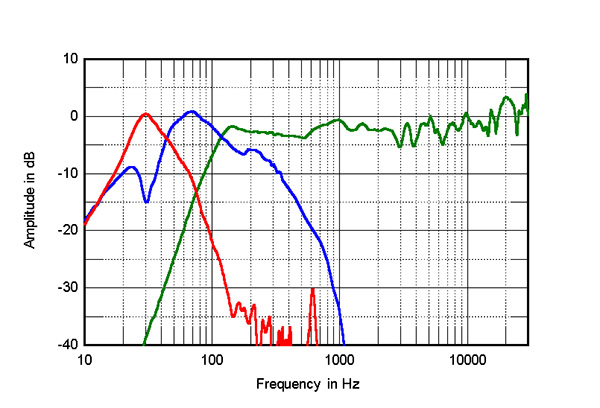
Fig.3 MoFi SourcePoint 888, acoustic crossover on tweeter axis at 1m, corrected for microphone response, with the nearfield responses of the midrange unit (green), woofers (blue), and ports (red), plotted below 355Hz, 1050Hz, and 700Hz.
The saddle centered at 30Hz in the magnitude trace in fig.1 indicates that the tuning frequency of the two ports on the rear panel lies in this region. The red trace in fig.3 shows the summed nearfield response of the ports. Their output reaches its maximum at the tuning frequency and the upper-frequency rollout is clean, other than a low-level resonant peak at 600Hz. The two woofers behaved identically, and the sum of their outputs measured in the nearfield (fig.3, blue trace) has the expected minimum-motion notch at the port tuning frequency. The woofers cross over to the midrange section of the coaxial driver (green trace) close to the specified 130Hz, and the farfield response is generally even.
The complex sum of the woofer and port responses (black trace below 300Hz in fig.4) has only a slight rise in the midbass response due to the nearfield measurement technique, which assumes that the drive units are mounted in a true infinite baffle (footnote 2). This indicates that the SourcePoint 888's woofer alignment is slightly overdamped. Yet the speaker offers extended low frequencies, with the summed nearfield output down by 6dB at 25Hz.
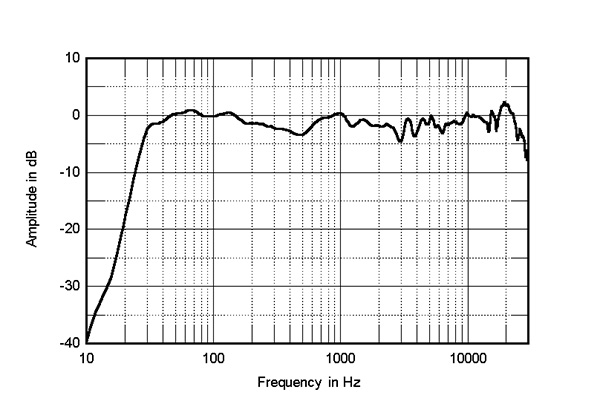
Fig.4 MoFi SourcePoint 888, anechoic response on tweeter axis at 1m, averaged across 30° horizontal window and corrected for microphone response, with the complex sum of the nearfield responses plotted below 300Hz.
The black trace above 300Hz in fig.4 shows the SourcePoint 888's quasi-anechoic farfield response averaged across a 30° horizontal window centered on the tweeter axis. The response is again even, though with a slight lack of energy in the midrange. The pair matching between the two samples was excellent, meeting ±0.5dB limits between 1kHz and 20kHz. The responses in figs.3 and 4 were taken without the skeletal grille. Repeating the response measurement with the grille on reduced the level slightly between 1kHz and 6kHz and between 7kHz and 9kHz.
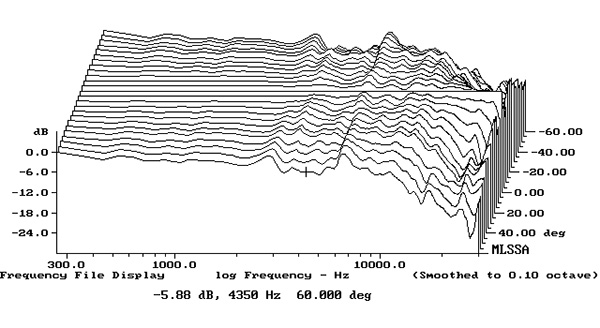
Fig.5 MoFi SourcePoint 888, lateral response family at 1m, normalized to response on tweeter axis, from back to front: differences in response 60–5° off axis, reference response, differences in response 5–60° off axis.
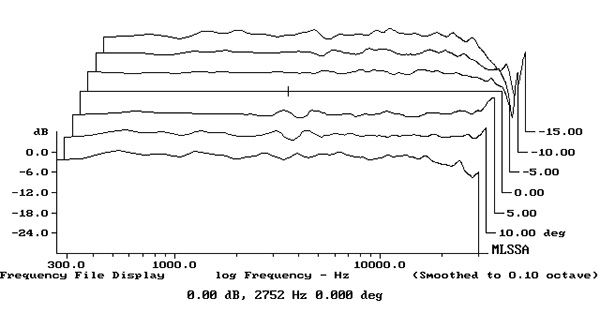
Fig.6 MoFi SourcePoint 888, vertical response family at 1m, normalized to response on tweeter axis, from back to front: differences in response 15–5° above axis, reference response, differences in response 5–15° below axis.
Fig.5 shows the SourcePoint 888's horizontal dispersion, normalized to the response on the tweeter axis, which thus appears as a straight line. The radiation pattern doesn't start to narrow until 10kHz, and the contour lines in this graph are even and well-controlled, which correlates with accurate and stable stereo imaging. The MoFi speaker's radiation pattern in the vertical plane, again normalized to the tweeter-axis response, is shown in fig.6. The loudspeaker's response in the audioband doesn't change appreciably over a wide, ±15° angle.
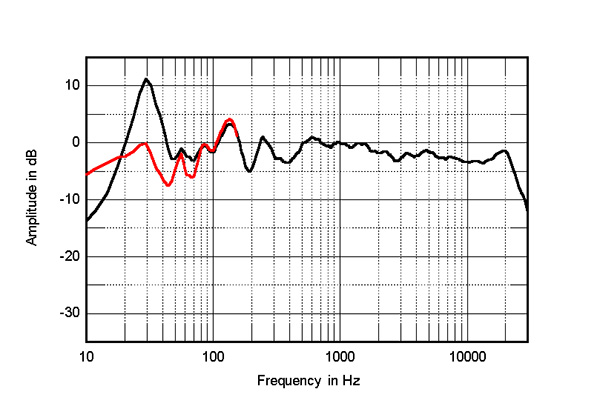
Fig.7 MoFi SourcePoint 888, spatially averaged, 1/6-octave response in JA's listening room with ports open (black) and with ports closed (red).
The black trace in fig.7 shows the MoFi SourcePoint 888s' spatially averaged response in my listening room (footnote 3). The spatial averaging hasn't quite eliminated the small peaks and dips between 50Hz and 500Hz, but the in-room response is creditably even above that region. The slight downward slope in the treble will be due mostly to the increased absorption of the room's furnishings as the frequency increases. However, this graph also shows that the low bass is boosted by 11dB, a result of the tuning frequency of the ports coinciding with that of the lowest-frequency mode in my room. I repeated the measurement with both ports blocked. The low bass is now slightly suppressed (red trace) but extends lower in frequency.
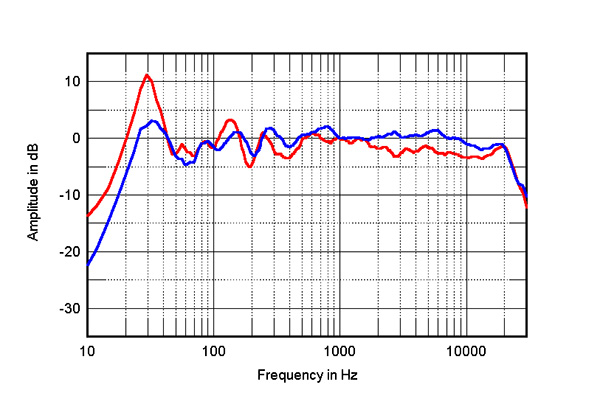
Fig.8 MoFi SourcePoint 888, spatially averaged, 1/6-octave response in JA's listening room (red) and of SourcePoint 10 (blue).
Fig.8 compares the SourcePoint 888's spatially averaged response with the ports open with that of the SourcePoint 10, which I reviewed in February 2023. The in-room responses of the two speakers are similar between 45Hz and 2kHz, though the 888s excite the lowest-frequency room mode to a much greater extent. While the SourcePoint 888s have the textbook, gently sloped-down response in the treble, the SourcePoint 10s have a flat in-room response up to the top audio octave. As I noted in my review of the earlier speaker, its treble balance was slightly tipped up, though it didn't sound bright as such.
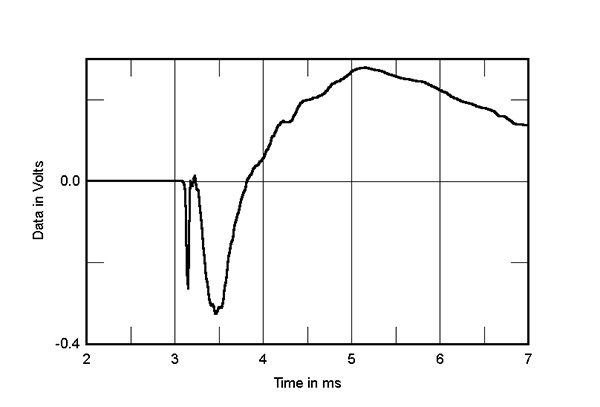
Fig.9 MoFi SourcePoint 888, step response on tweeter axis at 1m (5ms time window, 30kHz bandwidth).
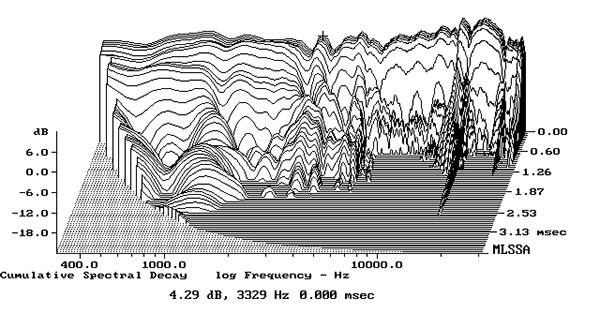
Fig.10 MoFi SourcePoint 888, cumulative spectral-decay plot on tweeter axis at 1m (0.15ms risetime).
Turning to the time domain, the SourcePoint 888's step response (fig.9) indicates that the tweeter and midrange are both connected in inverted acoustic polarity, the woofers in positive polarity. The tweeter's output arrives first at the microphone, followed by that of the midrange unit then that of the woofers. The decay of the midrange's step smoothly blends with the start of the woofer's step, which implies an optimal arrangement of the drive units' physical placement coupled with the phase behavior of the crossover filters. The SourcePoint 888's cumulative spectral-decay plot (fig.10) is very clean overall, though some delayed energy is present at the bottom of the tweeter's passband.
The MoFi SourcePoint 888's measured performance is superb.—John Atkinson
Footnote 1: See EPDR is the resistive load that gives rise to the same peak dissipation in an amplifier's output devices as the loudspeaker. See "Audio Power Amplifiers for Loudspeaker Loads," JAES, Vol.42 No.9, September 1994, and stereophile.com/reference/707heavy/index.html. Footnote 2: This means that the loudspeaker is firing into hemispherical space rather than a full sphere. A speaker that has a truly flat response in the usual "4pi" space will therefore appear to have a boosted upper-bass output with a nearfield measurement, the center frequency of that boost depending on the physical dimensions of the speaker and the woofer alignment. See this discussion.


