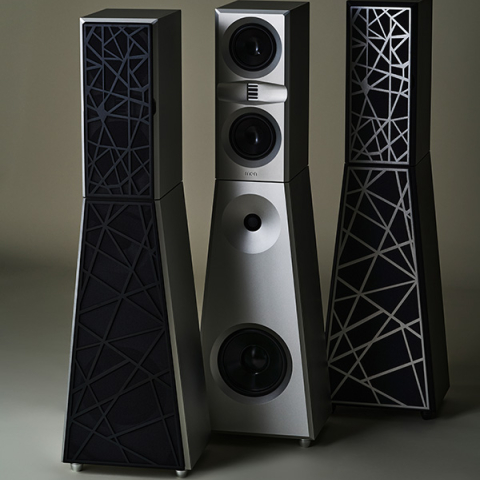
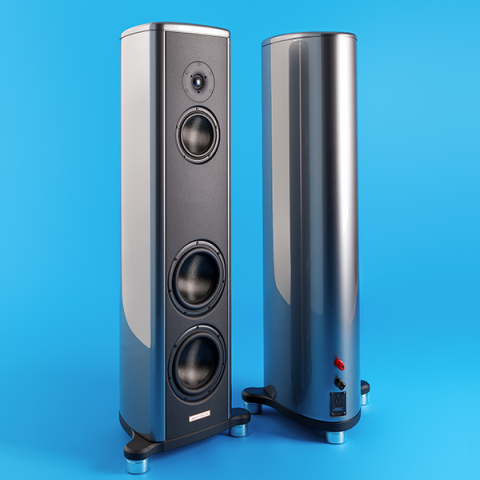
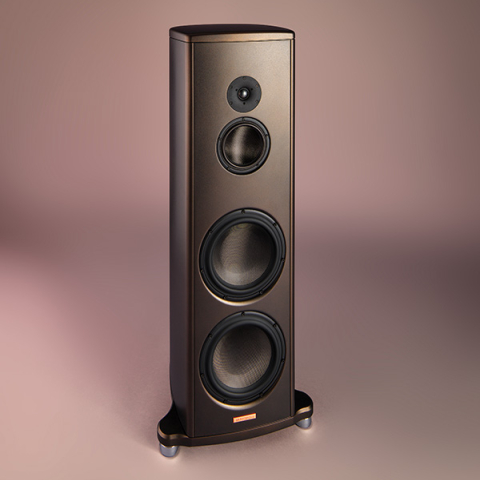
I used DRA Labs' MLSSA system and a calibrated DPA 4006 microphone to measure the Rockport Avior II's frequency response in the farfield, and an Earthworks QTC-40 for the nearfield and in-room responses. A complication was that the 220-lb loudspeaker was too bulky for me to move it outside for the testing, or to lift it onto my computer-controlled turntable. I therefore had to do the quasi-anechoic measurements in my listening room, where the proximity of room boundaries led to more than usually aggressive windowing of the time-domain data, which in turn reduced the graphs' resolution in the midrange.
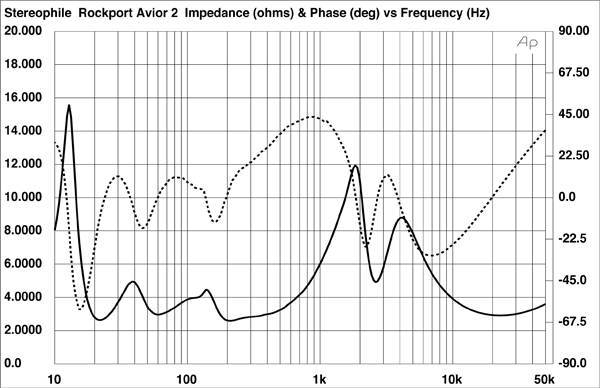
My estimate of the Rockport's voltage sensitivity was 89dB/2.83V/m, slightly higher than the specified 88dB. Fig.1 shows how the Avior II's impedance magnitude and electrical phase angle varied with frequency. There's no getting away from the fact that the Rockport is a relatively difficult load for the partnering amplifier to drive. The impedance remains between 3 and 5 ohms between 17 and 850Hz, with a minimum magnitude of 2.6 ohms at 210Hz. Although the electrical phase angle remains low over most of this region, it does increase to 43° at 760Hz, where the magnitude is still low, at 4.5 ohms. With this speaker, tube amplifiers should probably work best when used from their 2 ohm transformer taps.
With one exception, the Avior II's heroically constructed enclosure seemed inert when I listened to the behavior of its panels with a stethoscope while I slowly swept a sinewave up and down through the upper bass and midrange. The exception was the section of the rear panel between the port and the binding posts, where I could hear a strong, high-Q (Quality Factor) resonant mode between 560 and 570Hz. (This was with the left speaker; the mode was slightly higher in frequency in the right speaker.) Further investigation with an accelerometer revealed that this resonance was also present, at a lower level, toward the bottom of the two side panels and on the rear of the base. There is no evidence of this mode in the impedance traces, and as the affected areas are relatively small and the resonance is of high Q (footnote 1), it's possible that the effect of this resonance on sound quality will be negligible. But I do wonder if it was responsible for the slight amount of character I noted with some piano recordings—the mode lies close to the frequencies of the notes C-sharp (554.4Hz) and D (587.3Hz).
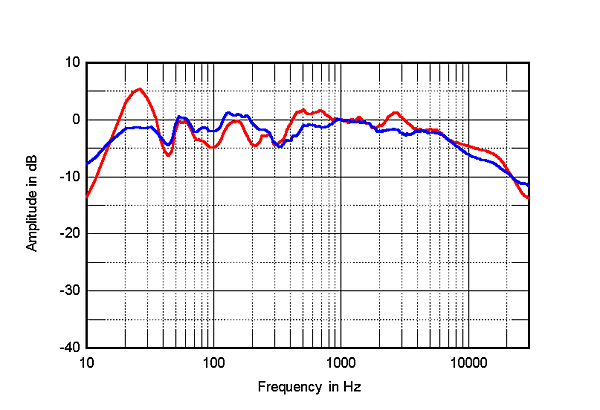
The saddle centered at 22Hz in the impedance-magnitude trace suggests that this is the tuning frequency of the large, rear-facing port. However, measured in the nearfield, the two woofers (which behaved identically) have their minimum-motion notch a little higher in frequency, at 28Hz (fig.2, red trace). This is the frequency where the woofer cones are held stationary by the back pressure from the port resonance; the port's output (blue trace) peaks both a little lower and a little higher in frequency than 28Hz, but rolls off smoothly above 60Hz, with no resonances apparent in its higher-frequency response. The woofers' output covers a relatively narrow bandpass, crossing over to the midrange unit (green trace) at 150Hz and rolling off with a steep, approximately 18dB/octave slope. The midrange unit rolls in with the same third-order slope, then offers an astonishingly flat response until it's crossed over to the tweeter at 2.3kHz. Other than a small suckout between 6 and 9kHz, the Avior II's response in the region covered by the tweeter is also superbly flat.
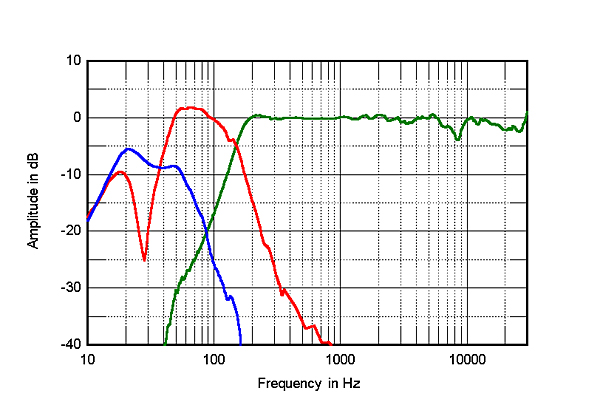
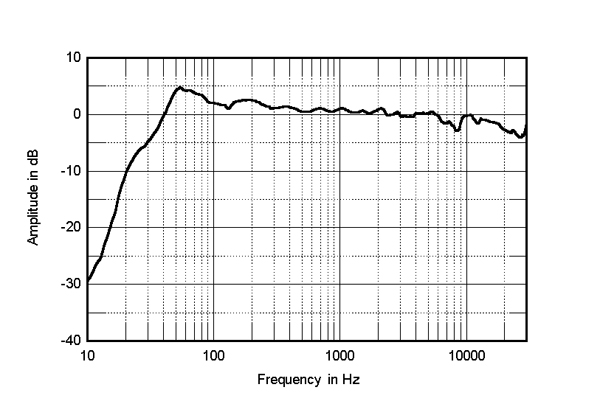
Fig.3 shows how the individual responses sum on the tweeter axis, with the response averaged across a 30° horizontal window. The rise in output in the midbass region is almost entirely an artifact of the nearfield measurement technique used to measure the response below 300Hz in this graph. While there is still a slight lack of energy apparent in the mid-treble, this is less deep than in fig.2 because it fills in to the speaker's sides, as can be seen in fig.4. Other than that small suckout, the Avior II's quasi-anechoic response falls within an extraordinarily tight limit of ±1.2dB from 280Hz to 15kHz. Even more notable, the outputs of the two speakers of the review pair matched to with 0.5dB across the same range.
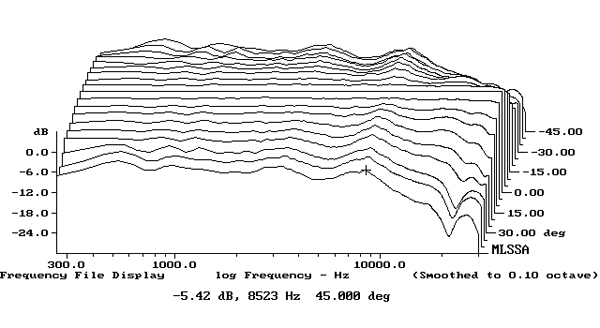
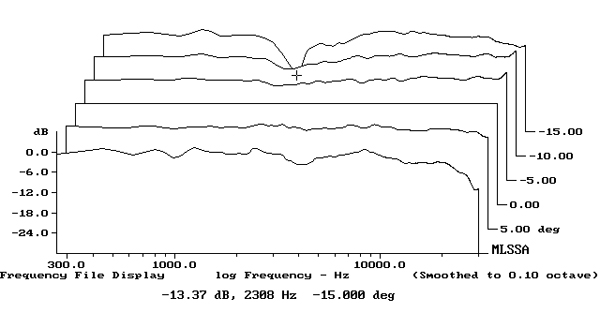
Because of the practical limitations mentioned earlier, I plotted the Rockport's horizontal dispersion across a ±45° window rather than my usual ±90°. The result, with each off-axis response normalized to the tweeter-axis response, is shown in fig.4. Other than the mid-treble suckout tending to fill in to the speaker's sides, the contour lines in this graph are evenly spaced. This behavior always correlates with accurate, stable stereo imaging. As expected from the waveguide surrounding the tweeter, the Avior II starts to become directional in the top octave, but not significantly so until more than 15° to the side. In the vertical plane (fig.5), the Rockport's balance is maintained over a wide (±10°) window centered on the tweeter axis, with a suckout at the upper crossover frequency not appearing until 15° above that axis.
The red trace in fig.6 shows the Avior II's spatially averaged response in my listening room with, for reference, that of the Magico S5 Mk.II, which I reviewed in February. (The in-room response of both speakers was calculated by averaging 20 1/6-octave–smoothed spectra, individually taken for the left and right speakers using SMUGSoftware's FuzzMeasure 3.0 program and a 96kHz sample rate, in a rectangular grid 36" wide by 18" high and centered on the positions of my ears. This mostly eliminates the room acoustic's effects.) The coincidence of the port tuning and the lowest-frequency mode in my room boosts the Rockports' output in the octave between 18 and 36Hz, a region where the sealed-enclosure Magicos were more neutrally balanced. The Magicos also had more energy in the lower midrange than the Rockports, and a smoother rolloff in the treble. (Because of the increased absorptivity of the room furnishings at high frequencies, the optimal response in this kind of graph is not flat in the treble, but smoothly slopes down.) I'm puzzled why the Avior II's in-room response had a slight excess of energy in the presence region in this graph while its quasi-anechoic response was superbly flat; I wonder if this correlates with the slightly forward balance I noted in this region.
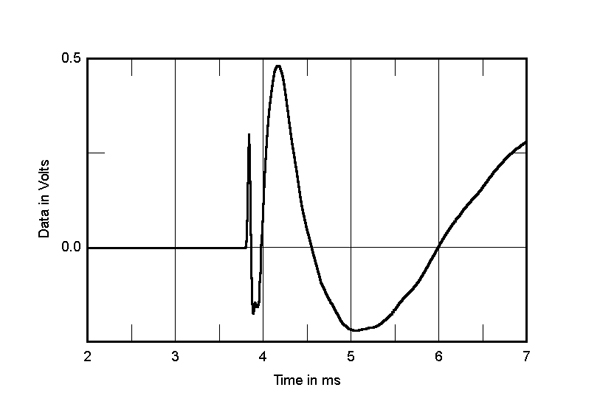
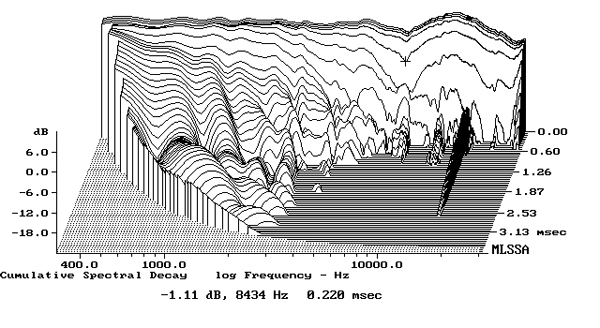
Turning to the time domain, the Avior II's step response on its tweeter axis is shown in fig.7, which reveals that all four drive-units are connected in positive acoustic polarity. While the tweeter output arrives at the microphone before that of the midrange unit, which in turn arrives before that of the woofers, the decay of each unit's step blends smoothly with that of the next lower in frequency. This, in conjunction with the speaker's slightly sloped-back front baffle, indicates optimal crossover design. The Avior II's cumulative spectral-decay plot (fig.8) features a superbly clean initial decay.
Overall, the Rockport Avior II's measured performance indicates some excellent speaker engineering.—John Atkinson
Footnote 1: Work by Floyd Toole and Sean Olive has shown that the higher the Q of a resonance, the less audible it will be. This is because the resonance needs an increasing amount of time for it to be excited with energy at the same frequency to fully develop.