Sidebar 3: Measurements
When I unpacked the Philharmonic Audio BMR Monitor, there was a rectangular yellow mask protecting the RAAL ribbon tweeter. I followed the instructions printed on the mask to slide it away carefully, before starting the measurements. I used DRA Labs' MLSSA system, a calibrated DPA 4006 microphone, and an Earthworks microphone preamplifier to measure the loudspeaker's quasi-anechoic frequency- and time-domain behavior in the farfield. I used an Earthworks QTC-40 microphone, which has a small, ¼" diameter capsule, for the nearfield responses and Dayton Audio's DATS v2 system to measure the impedance magnitude and phase.
Footnote 1: EPDR is the resistive load that gives rise to the same peak dissipation in an amplifier's output devices as the loudspeaker. See "Audio Power Amplifiers for Loudspeaker Loads," JAES, Vol.42 No.9, September 1994, and stereophile.com/reference/707heavy/index.html.
Footnote 2: See philharmonicaudio.com/pages/measurements/#bmr-monitor.
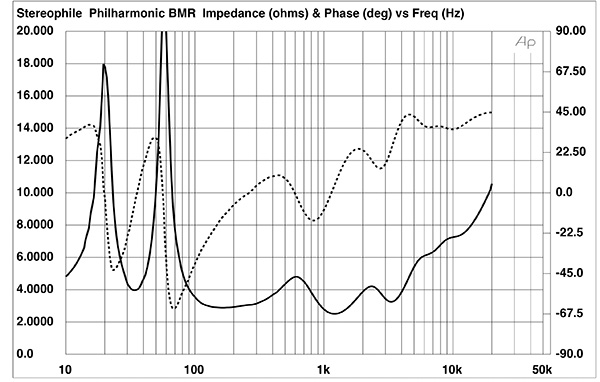
Fig.1 Philharmonic BMR Monitor, electrical impedance (solid) and phase (dashed) (2 ohms/vertical div.).
Philharmonic specifies the BMR Monitor's voltage sensitivity as 86.5dB/2.83V/1m; my estimate was within experimental error of that figure, at 86.2dB(B)/2.83V/1m. The BMR Monitor's nominal impedance is specified as 4 ohms; the impedance magnitude (fig.1, solid trace) lies between 3 ohms and 5 ohms from 80Hz to 5kHz. The minimum impedances were 2.9 ohms between 152Hz and 190Hz and 2.5 ohms at 1220Hz. As the electrical phase angle (fig.1, dotted trace) is high in several frequency regions, the effective resistance or EPDR (footnote 1) drops below 3 ohms over most of the audioband and below 2 ohms from 69Hz to 181Hz and from 861Hz to 5.5kHz. The minimum EPDR values were 2.63 ohms at 43Hz, 1.25 ohms between 93Hz and 107Hz, and 1.5 ohms between 1.5kHz and 1.6kHz. The BMR Monitor is a very demanding load for the partnering amplifier.
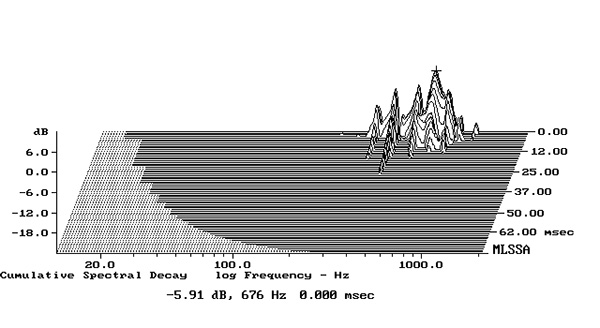
Fig.2 Philharmonic BMR Monitor, cumulative spectral-decay plot calculated from output of accelerometer fastened to the center of a sidewall level with the woofer (MLS driving voltage to speaker, 7.55V; measurement bandwidth, 2kHz).
The enclosure seemed inert when I rapped its panels with my knuckles. Using a plastic-tape accelerometer, I found a group of resonant modes between 400Hz and 800Hz on the side panels (fig.2), as well as a mode at 813Hz on the top panel. These modes are all relatively high in frequency, have a high Q (Quality Factor), and are low in level, all factors that will work against audible consequences.
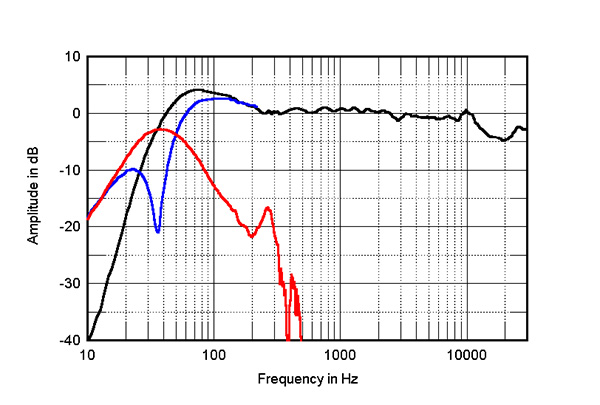
Fig.3 Philharmonic BMR Monitor, anechoic response on tweeter axis at 50", averaged across 30° horizontal window and corrected for microphone response, with the nearfield responses of the woofer (blue), port (red), and their complex sum respectively plotted below 300Hz, 1kHz, and 310Hz.
The saddle centered on 36Hz in the impedance magnitude trace implies that this is the tuning frequency of the port on the Philharmonic's rear panel. The woofer's nearfield response (blue trace below 300Hz in fig.3) has the expected notch at this frequency and the port's nearfield response (fig.3, red trace) peaks at the same frequency. Other than low-level peaks at 280Hz and 410Hz, the port's high-frequency rolloff is clean. The peak in the upper bass in the complex sum of the woofer's and port's nearfield responses (fig.3, black trace below 310Hz) is due to the nearfield measurement technique, which assumes the baffle extends to infinity in both planes. This BMR Monitor's low-frequency alignment is actually maximally flat in textbook fashion, with low frequencies that extend to –6dB at the port tuning frequency.
I examined the loudspeaker's farfield response, averaged across a 30° horizontal window centered on the tweeter axis. The result is shown as the black trace above 300Hz in fig.3. The response is superbly even through the midrange and treble but shelves down gently above 11kHz to reach –5dB at 20kHz. The manufacturer's own on-axis response measurement is flat to 20kHz (footnote 2), so I checked my result by repeating the tweeter-axis measurement with the Earthworks microphone, then on the midrange axis, again averaging the responses across a 30° horizontal window. There were no significant differences between these responses and that shown in fig.3. These measurements were taken without the grille; repeating it with the grille in place gave a small suckout and peak in the treble but no changes above 12kHz.
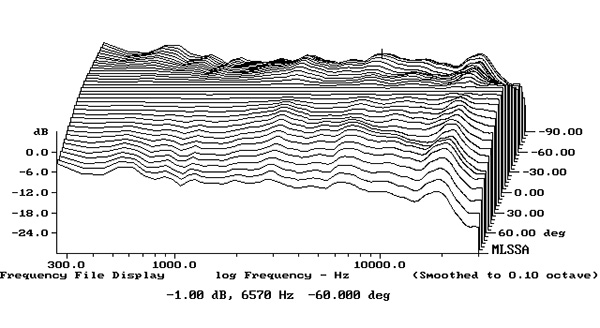
Fig.4 Philharmonic BMR Monitor, lateral response family at 50", normalized to response on tweeter axis, from back to front: differences in response 90–5° off axis, reference response, differences in response 5–90° off axis.
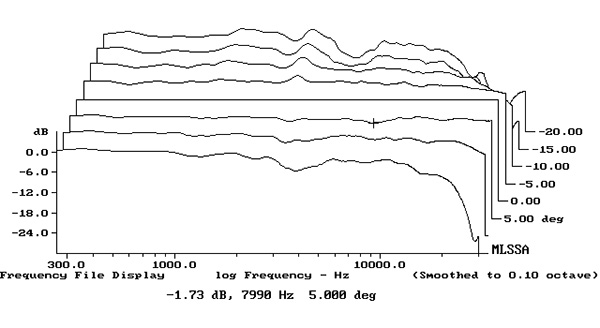
Fig.5 Philharmonic BMR Monitor, vertical response family at 50", normalized to response on tweeter axis, from back to front: responses 20–5° above axis, reference response, responses 5–15° below axis.
The Philharmonic's horizontal radiation pattern, normalized to the response on the tweeter axis, which therefore appears as a straight line, is shown in fig.4. The contour lines are smooth and evenly spaced in the midrange and low treble, which correlates with precise and stable stereo imaging. However, the output in the top octave tends to drop off to the speaker's sides, which might be the cause of the droop in response in this region seen in fig.3. Fig.5 shows the BMR Monitor's dispersion in the vertical plane, again normalized to the response on the tweeter axis. The speaker's output doesn't change significantly over a wide ±10° vertical window centered on the tweeter axis.
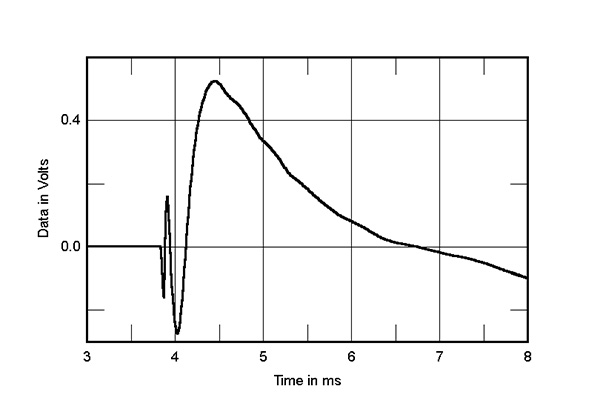
Fig.6 Philharmonic BMR Monitor, step response on tweeter axis at 50" (5ms time window, 30kHz bandwidth).
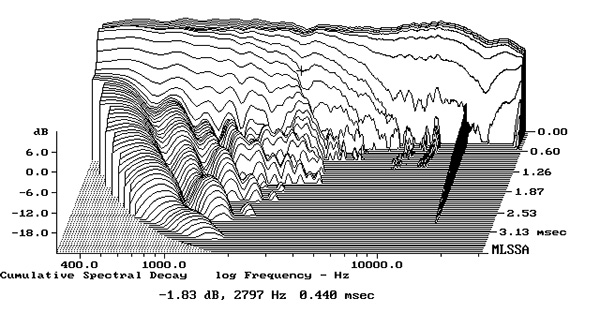
Fig.7 Philharmonic BMR Monitor, cumulative spectral-decay plot on tweeter axis at 50" (0.15ms risetime).
Turning to the time domain, the Philharmonic's step response on the tweeter axis (fig.6) indicates that the two upper frequency drive units are connected in inverted acoustic polarity, the woofer in positive polarity. However, the decay of each unit's step smoothly blends with the start of the step of the next lower in frequency, which implies an optimal crossover topology. The BMR Monitor's cumulative spectral decay—waterfall—plot (fig.7) is impressively clean from the midrange through to the treble. (As always with my waterfall plots, ignore the small ridge of delayed energy close to 16kHz, which is due to interference from the MLSSA host PC's video circuitry.)
Overall, the Philharmonic BMR Monitor offers superb measured performance. Its current-hungry impedance will require careful amplifier matching.—John Atkinson
Footnote 1: EPDR is the resistive load that gives rise to the same peak dissipation in an amplifier's output devices as the loudspeaker. See "Audio Power Amplifiers for Loudspeaker Loads," JAES, Vol.42 No.9, September 1994, and stereophile.com/reference/707heavy/index.html.