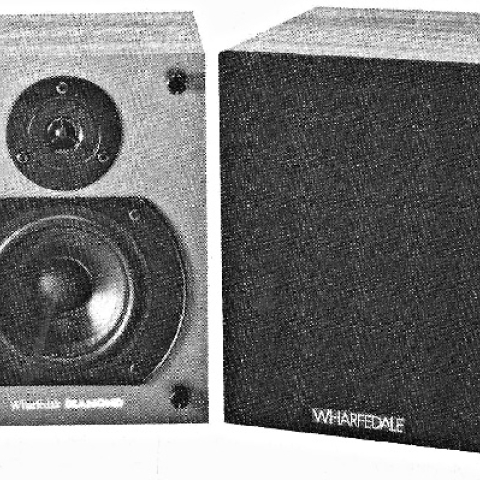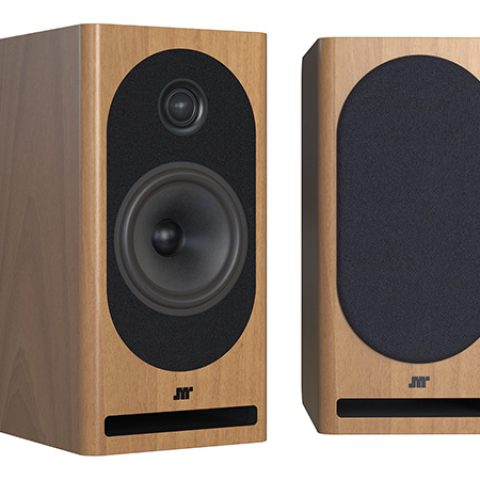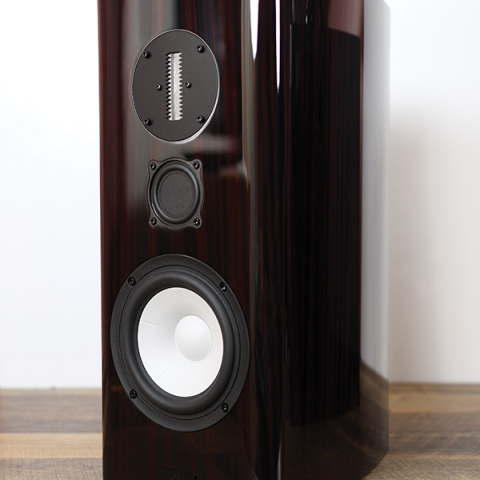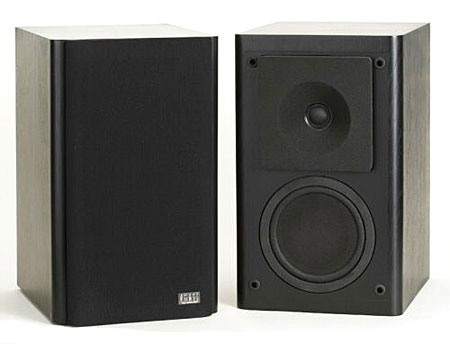
Starting with the Listening Environment Diagnostic Recording (LEDR) on the Chesky Sampler and Test CD (JD37), the PC80s produced a good sense of the image moving up above the loudspeaker. The "over" test was better, with a clearly defined arc between and above the loudspeakers. The "lateral" test was excellent: the image was solid and moved contiguously between the PC80s. Next, I drove one loudspeaker with a variable-frequency sinewave oscillator, listened for any audible problems, and felt the cabinet for any sign of resonance modes. Not surprising in light of their rigid construction, the PC80s were extremely inert. Even with high input levels, the cabinet was rock solid. The only resonance I detected was at 330Hz, and this was minimal. Next to the extraordinarily constructed Hales System Two Signatures, the PC80s were the most resonance-free cabinets on which I've performed this experiment.
The PC80's impedance magnitude and phase angle (solid and dotted lines respectively) show the port's 52Hz tuning (fig.1). The impedance dips to 4 ohms at about 200Hz and stays at about 5 ohms above 3kHz, suggesting that the PC80s are not a difficult load, but a fairly solid amplifier is recommended. Note the rise in impedance below 25Hz due to the additional infrasonic filtering.

Fig.1 Phase Technology PC80, electrical impedance (solid) and phase (dashed) (2 ohms/vertical div.).
Looking next at the FFT-derived frequency response spatially averaged over a 30° lateral window (fig.2), we can see a basically very flat response, but with an increase in energy between 2kHz and 5kHz and a peak at 2.5kHz. When I saw these curves (after I had completed the auditioning), I could immediately correlate them with my impression of too much upper-midrange energy, which was manifested as a nasal, reedy character to saxophone and a too-prominent reproduction of "s" and "ch" sounds in voice. Although the PC80's overall response appears quite flat, the amplitude anomalies it does have unfortunately occur exactly where the ear is most sensitive. The ear's ability to distinguish amplitude changes varies enormously with frequency. If the PC80's midrange hump had been in any other area, it would have been much less audible. Looking at the individual response curves taken at various positions off-axis before the spatial averaging (not shown) revealed that the midrange hump as well as the excessive treble energy are much less severe as one gets off-axis. Listening with the speakers pointed straight ahead is therefore indicated (and was also indicated by the auditioning), despite the slight loss of center-channel solidity and pinpoint image specificity.

Fig.2 Phase Technology PC80, anechoic response on tweeter axis at 45", averaged across 30° horizontal window and corrected for microphone response, with nearfield woofer and port responses plotted below 300Hz and 800Hz, respectively.
The curves on fig.2's left-hand side are nearfield measurements of the woofer and port, respectively, taken with the Audio Precision System One and appended to the MLSSA FFT-derived frequency-response curves. The port's output is fairly broad and can be seen to augment the woofer's rapid rolloff. (The port tuning is shown by the minimum in the woofer output at 50Hz.) These curves correlate with my impression of good extension, but with excessive energy in the bass, perhaps the result of the wide overlap between the woofer and port outputs.
The PC80's impulse response, shown in fig.3, is quite clean, but with a hump delayed from the impulse. This is generally typical of higher-order crossover filters. The step response is shown in fig.4.

Fig.3 Phase Technology PC80, impulse response on tweeter axis at 45" (5ms time window, 30kHz bandwidth).

Fig.4 Phase Technology PC80, step response on tweeter axis at 45" (5ms time window, 30kHz bandwidth).
Finally, the PC80's cumulative spectral decay or "waterfall" plot can be seen in fig.5. The peak at 2.5kHz mentioned earlier can be clearly seen, and is accompanied by a ridge at that frequency, indicating the delayed release of stored energy. Since this graph was derived from the impulse response taken directly on-axis, the treble rise and midband peak are at their maximum and will be less pronounced off-axis. The treble decay is extremely clean and fast, and among the best measured. The dark ridge at 16kHz is a measurement artifact (the computer's line-scanning frequency) and not a loudspeaker characteristic.—Robert Harley

Fig.5 Phase Technology PC80, cumulative spectral-decay plot at 45" (0.15ms risetime).