Sidebar 4: Measurements
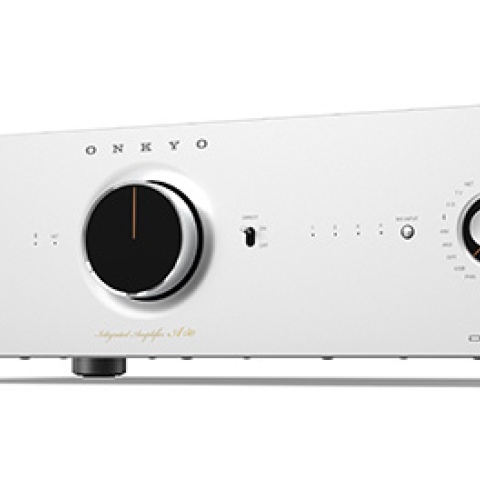
I performed a full set of measurements on the Onkyo A-50 with my Audio Precision SYS2722 system. Except when noted,the A-50 was set to Direct mode for the testing, which bypasses the analog/digital conversion and digital signal processing. Before I started the measurements, I preconditioned the amplifier by operating it at 1/8 the specified power into 8 ohms for 30 minutes. At the end of that time, the temperature of the top panel over the internal heatsinks was 98.1°F/36.8°C. After a couple of hours of operation, the temperature had risen to 102.9°F/39.4°C.
Looking first at the Onkyo A-50's line-level inputs, the amplifier preserved absolute polarity, ie, was noninverting, at the loudspeaker, Preamplifier, and headphone outputs. The line input impedance was a high 34k ohms at 20Hz, 31k ohms at 1kHz, and 27k ohms at 20kHz. The volume control operates in accurate 0.5dB steps; with the volume control set to the maximum, the voltage gain at 1kHz was 43.8dB from the loudspeaker output into 8 ohms, 44.6dB from the headphone output, and 15dB from the Preamplifier output.
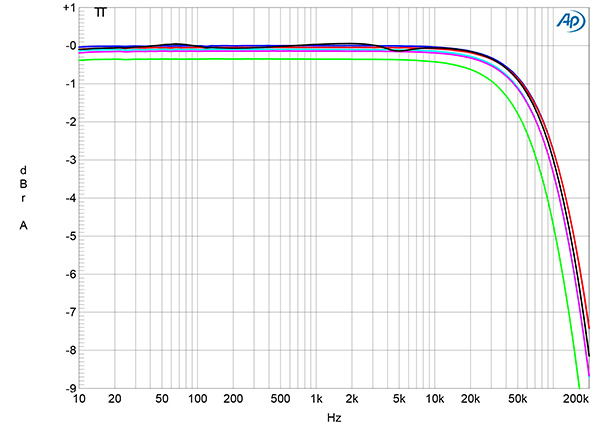
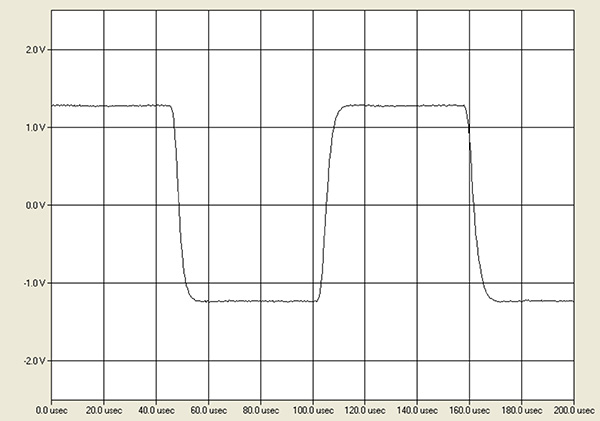
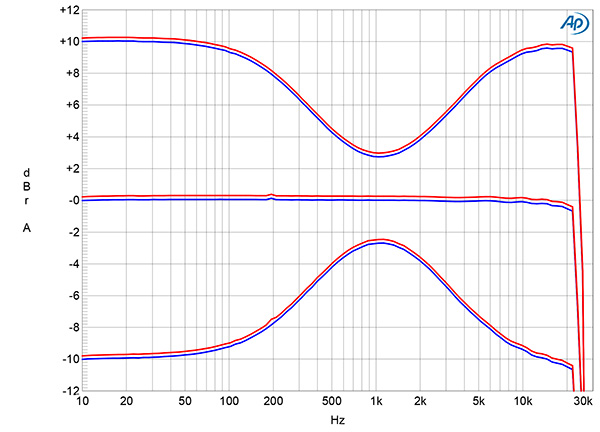
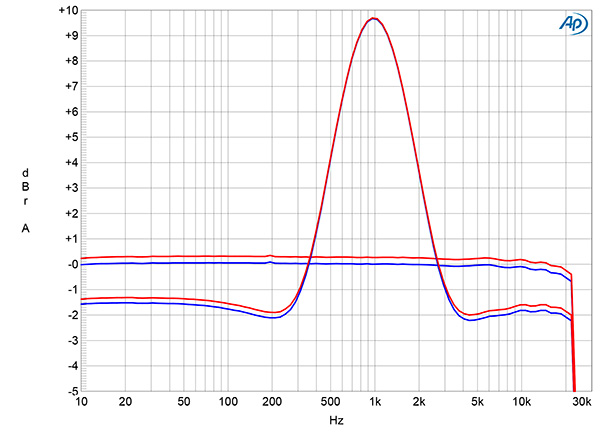
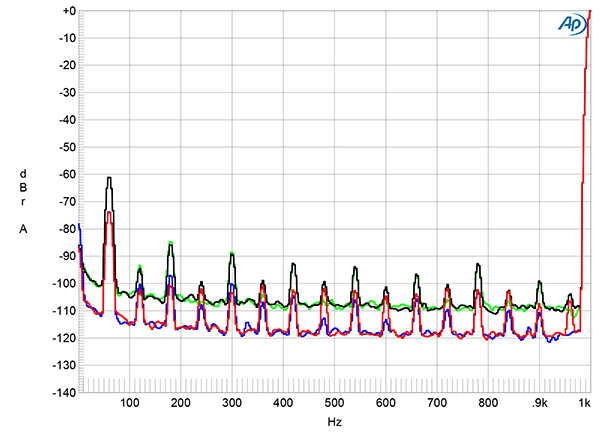
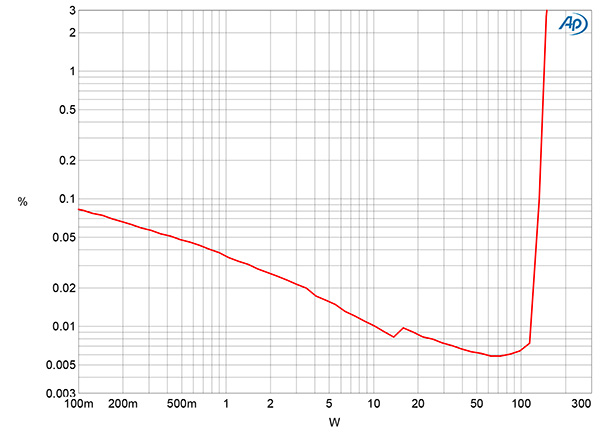
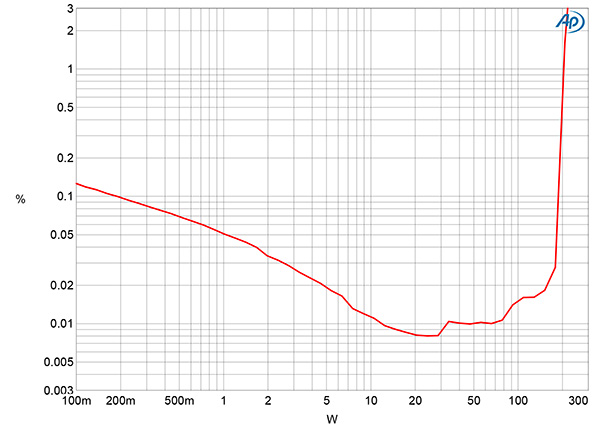
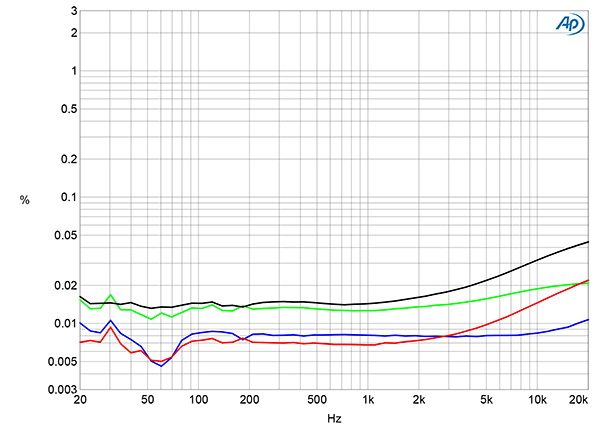
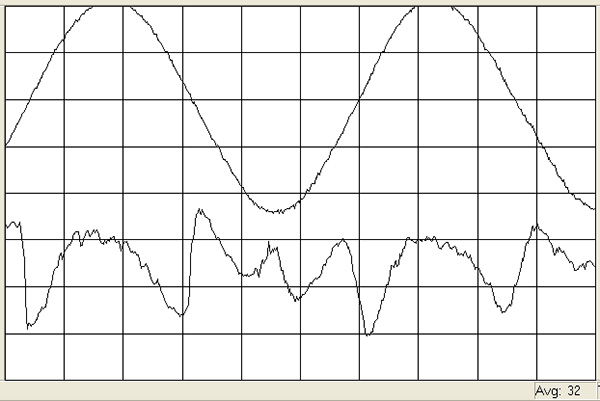
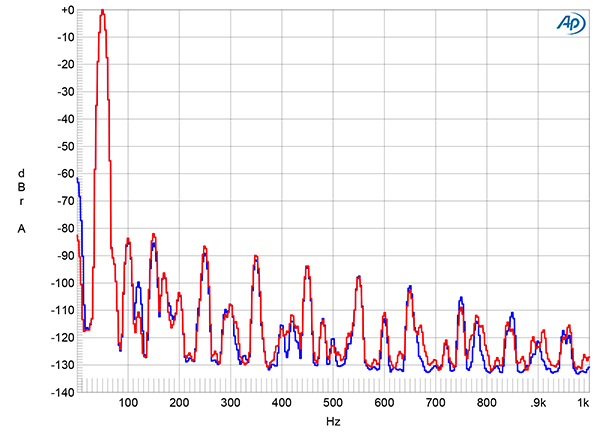
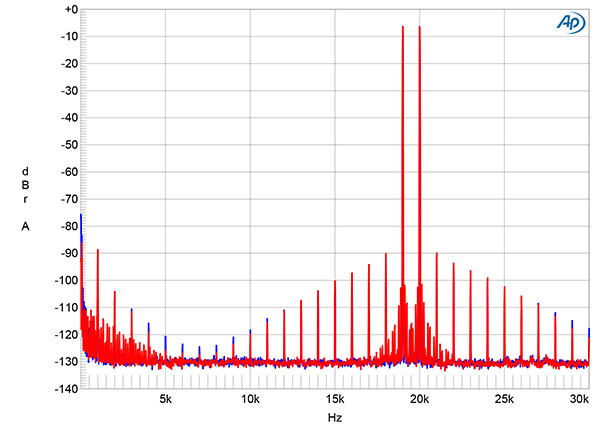
Fig.1 Onkyo A-50, Direct mode, line input, frequency response at 2.83V into: simulated loudspeaker load (gray), 8 ohms (left channel blue, right red), 4 ohms (left cyan, right magenta), 2 ohms (green) (1dB/vertical div.).
Fig.2 Onkyo A-50, Direct mode, line input, small-signal, 10kHz squarewave into 8 ohms.
The Preamplifier output impedance was 475 ohms from 20Hz to 20kHz; the single-ended headphone output's impedance was relatively high, at 316 ohms, again from 20Hz to 20kHz. The loudspeaker output impedance was low at 0.15 ohm at 20Hz and 1kHz, rising slightly to 0.19 ohm at 20kHz. The modulation of the Onkyo A-50's frequency response due to the Ohm's law interaction between this impedance and the impedance of our standard simulated loudspeaker was therefore just ±0.1dB (fig.1, gray trace). The amplifier's response into resistive loads (blue, red, cyan, magenta, and green traces) was flat in the audioband and –3dB at 100kHz. Both the very close channel balance and the overall response were preserved at lower settings of the volume control. The response from the headphone output was similar, while that from the Preamplifier output was down by just 1dB at 200kHz. There was no overshoot or ringing on the Onkyo A-50's reproduction of a 10kHz squarewave into 8 ohms (fig.2).
Fig.3 Onkyo A-50, DSP mode, line input, effect of bass and treble sliders set to the minimum, central, and maximum positions (left channel blue, right red) (2dB/vertical div.).
Fig.4 Onkyo A-50, DSP mode, line input, effect of Vocal/Dialog control (left channel blue, right red) (2dB/vertical div.).
Fig.3 shows the effect of the treble and bass tone controls with Direct mode disabled and the settings adjusted with the Onkyo Controller app installed on my iPad mini. The maximum boost and cut is the specified ±10dB, and as the output rolls off rapidly above 22kHz, it appears that the analog input is digitized with a sample rate of 48kHz. The app also allows a setting called "Vocal/Dialog" to be adjusted between "0" and "4." Set to "0," the response is flat up to 20kHz; set to "4," the levels below 300Hz and above 3kHz were reduced by up to 2dB and there was a 10dB peak between those regions (fig.4).
Fig.5 Onkyo A-50, Direct mode, line input, spectrum of 1kHz sinewave, DC–1kHz, at 1Wpc into 8 ohms with volume control set to the maximum (left channel green, right gray) and to –12dB (left blue, right red) (linear frequency scale).
Channel separation was moderate, at 65dB in both directions below 3kHz and 60dB at the top of the audioband. (I always look at the undriven channel's output with an oscilloscope to be sure I am measuring actual crosstalk rather than noise.) The wideband, unweighted signal/noise ratio, taken with the input shorted to ground and the volume control set to its maximum, was a good 67.5dB in both channels, ref. 2.83V, which is equivalent to 1W into 8 ohms. This ratio improved to 74.7dB when the measurement bandwidth was restricted to the audioband, and to 77.5dB when A-weighted. The spectrum of the Onkyo A-50's low-frequency noisefloor at 1Wpc into 8 ohms with the volume control set to its maximum is shown by the green and gray traces in fig.5. The spuriae at 60Hz and its odd-order harmonics are due to magnetic interference from the power transformer. The levels of both these spuriae and the random noise components dropped by 12dB when I set the volume control to –12dB and increased the level of the input signal so that the output was the same 1Wpc into 8 ohms (blue, red traces).
Fig.6 Onkyo A-50, line input, THD+N (%) vs 1kHz continuous output power into 8 ohms.
Fig.7 Onkyo A-50, line input, THD+N (%) vs 1kHz continuous output power into 4 ohms.
Figs.6 and 7 respectively plot how the THD+noise percentage in the Onkyo's output varies with power into 8 ohms and 4 ohms with both channels driven. Stereophile defines clipping as when the THD+N reaches 1%. The Onkyo A-50 clipped at 135Wpc into 8 ohms (21.3dBW) and at 200Wpc into 4 ohms (20dBW)—both exceeding the specified ratings. The FTC's updated "Amplifier Rule" states that maximum power should also be assessed at frequencies other than 1kHz. I therefore repeated the power test with a 20kHz signal. The amplifier clipped at the same 135Wpc into 8 ohms (21.3dBW) at this frequency as it had at 1kHz.
Fig.8 Onkyo A-50, line input, THD+N (%) vs frequency at 12.65V into 8 ohms (left channel blue, right red) and 4 ohms (left green, right gray).
The downward slope of the traces in figs.6 and 7 indicates that actual distortion lies beneath the noisefloor below a few tens of watts. Fig.8 shows how the A-50's THD+N percentage changed with frequency at 12.65V, which is equivalent to 20W into 8 ohms (blue, red traces) and 40W into 4 ohms (green, gray traces). The distortion+noise into both loads is very low, with a slight rise evident in the top audio octaves, particularly in the right channel (red, gray traces).
Fig.9 Onkyo A-50, line input, 1kHz waveform at 20W into 8 ohms, 0.019% THD+N (top); distortion and noise waveform with fundamental notched out (bottom, not to scale).
Fig.10 Onkyo A-50, line input, spectrum of 50Hz sinewave, DC–1kHz, at 40Wpc into 4 ohms (left channel blue, right red, linear frequency scale).
Fig.11 Onkyo A-50, line input, HF intermodulation spectrum, DC–30kHz, 19+20kHz at 40Wpc peak into 4 ohms (left channel blue, right red, linear frequency scale).
The THD+N waveform, taken at 12.65V into 8 ohms (fig.9), appears to comprise low-order harmonics, which was confirmed by spectral analysis (fig.10). Even at the same voltage into 4 ohms, the second and third harmonics lay below –80dB (0.01%), with higher-order harmonics lower in level. Intermodulation distortion with an equal mix of 19kHz and 20kHz tones at a peak level of 40W into 4 ohms was also low in level (fig.11).—John Atkinson