Sidebar 3: Measurements
When I unpacked the Amp No. 2, the volume control knob was loose in the box. I reattached it, but its operation was intermittent. I controlled the amplifier's volume with the supplied Apple remote for the testing.
I measured the Fern & Roby Amp No. 2 with my Audio Precision SYS2722 system, checking some of the test results with the magazine's APx555. Fern & Roby specifies the amplifier's maximum power as 25W; that presumably is into 8 ohms. I preconditioned the Amp No. 2 before the measurements by following the CEA's recommendation of running it at one-eighth the specified power into 8 ohms for 30 minutes. Following that period, the top panel was warm, at 98.0°F (36.7°C), and the temperature of the internal aluminum block that acts as a heatsink was 125.3°F (51.8°C).
Looking first at the line-level inputs, the amplifier preserved absolute polarity with both the single-ended and balanced inputs. The maximum gain into 8 ohms at the loudspeaker terminals was 45.3dB, left channel, and 46.6dB, right channel, for the balanced inputs. The maximum gain from the unbalanced inputs was 0.3dB higher than from the balanced input, with the same 1.3dB difference in the left- and right-channel gains. The balanced input impedance was 9k ohms from 20Hz to 20kHz; the single-ended input's impedance was a usefully high 75k ohms at 20Hz and 1kHz, dropping inconsequentially to 52k ohms at the top of the audioband. Despite its name, the Sub output was full-range and offered a maximum gain of 19.5dB, sourced from an output impedance of 370 ohms. The channel gains were closely matched from this output.
To examine the performance of the Amp No. 2's phono input, I connected a wire from one of the Audio Precision's ground terminals to the grounding lug on the amplifier's rear panel. The phono input can be switched between MM and MC operation with a pair of small toggle switches on the main circuit board. It preserved absolute polarity at the speaker and Sub outputs in both modes. In MM mode, the input impedance was 46k ohms at 20Hz and 66k ohms at 1kHz and 20kHz; in MC mode it was 470 ohms at 20Hz, 513 ohms at middle and high frequencies.
The maximum gain at 1kHz was very high from the loudspeaker output, at 86dB (MM) and 105.4dB (MC). These gains were around 20dB lower from the Sub output, so to avoid overdriving the amplifier's output stage, I performed all the subsequent phono stage measurements at the Sub output, with the volume control set to –12dB.
Footnote 1: These harmonics may be related to the fact that at these powers, the amplifier is no longer fully biased into class-A.
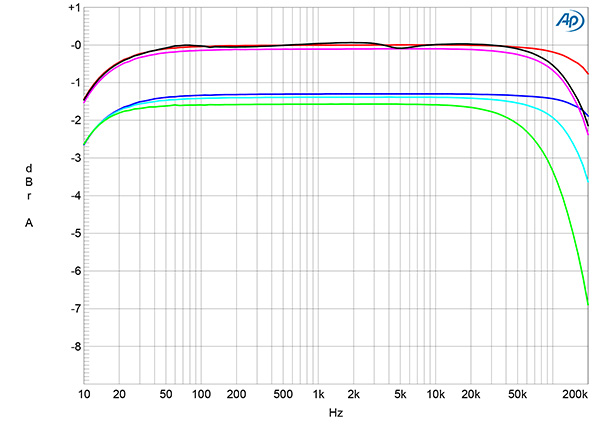
Fig.1 Fern & Roby Amp No.2, volume control set to maximum, frequency response at 2.83V into: simulated loudspeaker load (gray), 8 ohms (left channel blue, right red), 4 ohms (left cyan, right magenta), 2 ohms (green) (1dB/vertical div.).
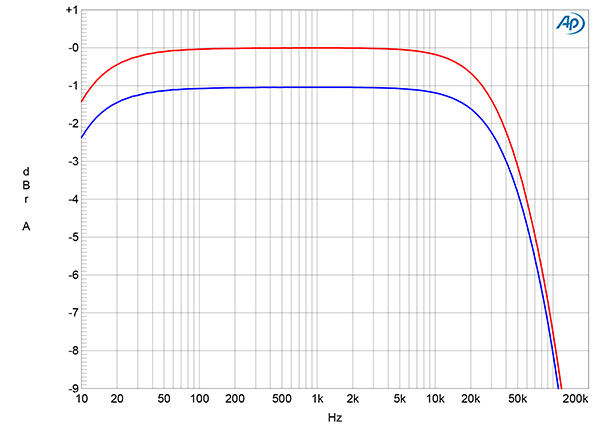
Fig.2 Fern & Roby Amp No.2, volume control set to –12dB, frequency response at 2.83V into 8 ohms (left channel blue, right red) (1dB/vertical div.).
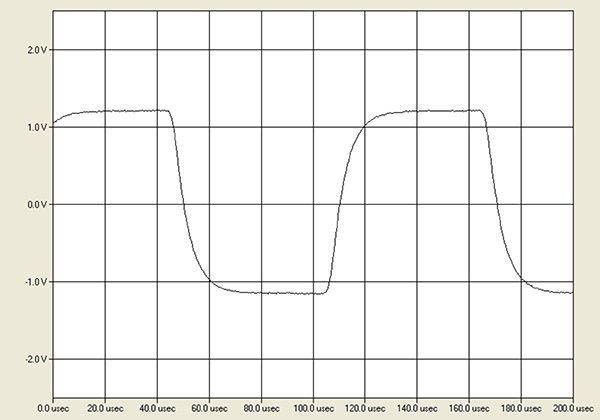
Fig.3 Fern & Roby Amp No.2, volume control set to –12dB, small-signal, 10kHz squarewave into 8 ohms.
The amplifier's output impedance, including 6' of spaced-pair speaker cable, was a low 0.09 ohms across the audioband. As a result, the modulation of the Amp No. 2's frequency response due to the Ohm's law interaction between this impedance and that of our standard simulated loudspeaker was minimal (fig.1, gray trace). The amplifier's response into 8 ohms (blue and red traces) extended almost to 200kHz but into lower impedances started to roll off above the audioband. Fig.1 was taken with the balanced inputs and with the volume control set to its maximum; the channel imbalance that can be seen in this graph was identical with the unbalanced inputs and at lower volume control settings. However, at lower settings of the volume control, the Amp No. 2's ultrasonic response rolled off at a lower frequency. The output into 8 ohms with the control set to –12dB was down by 0.5dB at 20kHz and by 3dB at 50kHz (fig.2). As a result, the amplifier's reproduction of a 10kHz squarewave had lengthened risetimes (fig.3).
Below 1kHz, channel separation from the speaker outputs was >70dB, but it decreased to 47dB at 20kHz, presumably due to capacitive coupling, perhaps at the shared volume control, as the circuitry for each channel is separated on the primary printed circuit board. The wideband, unweighted signal/noise ratio, taken with the unbalanced input shorted to ground and the volume control set to its maximum, was 62.7dB in the left channel, 65.3dB in the right channel, both ref. 2.83V, which is equivalent to 1W into 8 ohms. These ratios improved by just 1dB when the measurement bandwidth was restricted to the audioband and to 67dB in both channels when A-weighted.
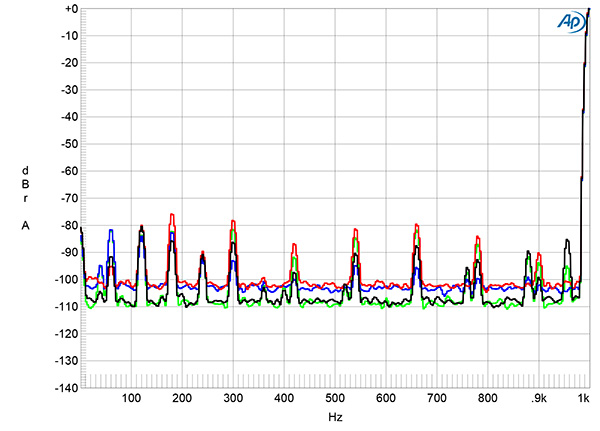
Fig.4 Fern & Roby Amp No.2, spectrum of 1kHz sinewave, DC–1kHz, at 1Wpc into 8 ohms with volume control set to the maximum (left channel blue, right red), and to –12dB (left green, right gray) (linear frequency scale).
The blue and red traces in fig.4 show the spectrum of the amplifier's low-frequency noisefloor at 1Wpc into 8 ohms and the volume control set to its maximum. Even- and odd-order harmonics of the AC supply frequency are present, and the level of random noise is higher than I usually find. Reducing the volume by 12dB and increasing the input signal by the same 12dB so that the output power remains at 1W (green and gray traces) reduced the level of the supply-related spuriae and random noise by 5–10dB.
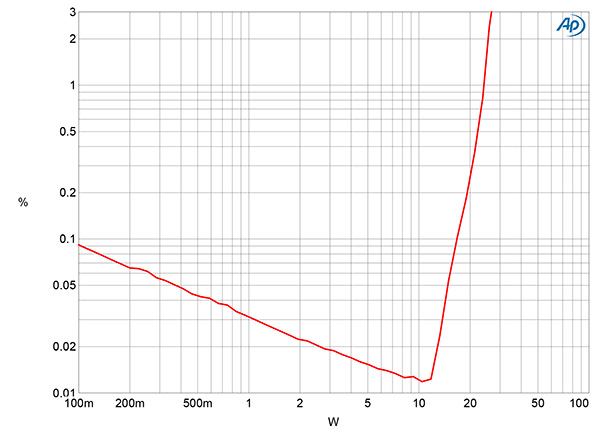
Fig.5 Fern & Roby Amp No.2, distortion (%) vs 1kHz continuous output power into 8 ohms.
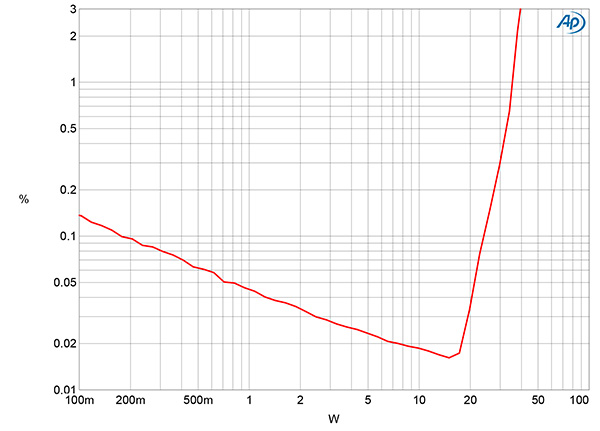
Fig.6 Fern & Roby Amp No.2, distortion (%) vs 1kHz continuous output power into 4 ohms.
Fig.5 plots how the left channel's THD+noise percentage varies with output power into 8 ohms with both channels driven. The downward slope of the trace below 12W means that the actual distortion lies below the noise up to that power. The THD+N reaches 1%, which is our definition of clipping, at the specified 25Wpc (14dBW). The Amp No. 2 clipped at 35Wpc into 4 ohms (fig.6, 12.4dBW).
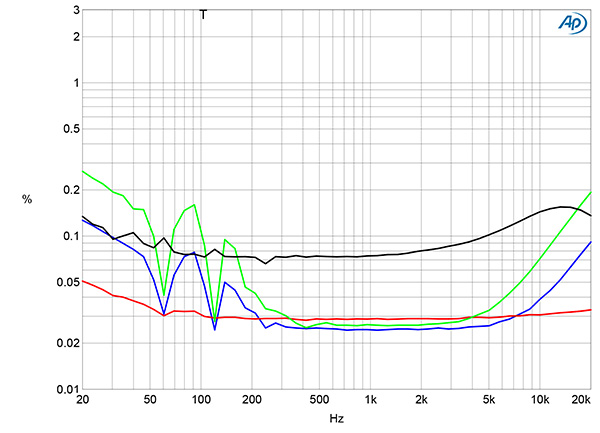
Fig.7 Fern & Roby Amp No.2, THD+N (%) vs frequency at 8V into: 8 ohms (left channel blue, right red), 4 ohms (left green, right gray).
Fig.7 shows how the THD+N percentage changed with frequency at 8V, which is equivalent to 8W into 8 ohms and 16W into 4 ohms. The distortion into 8 ohms (blue and red traces) is a low 0.03% over most of the audioband in both channels, though the THD increases below 200Hz and above 5kHz in the left channel (blue trace). The left channel behaved similarly into 4 ohms (green trace), but the THD+N percentage was higher across the band in the right channel (gray trace).
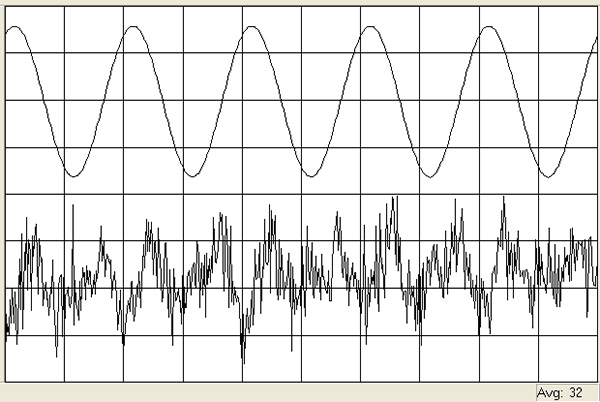
Fig.8 Fern & Roby Amp No.2, 1kHz waveform at 8W into 8 ohms, 0.021% THD+N (top); distortion and noise waveform with fundamental notched out (bottom, not to scale).
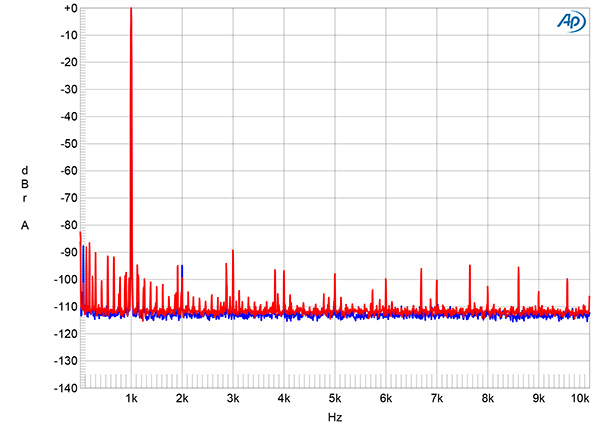
Fig.9 Fern & Roby Amp No.2, spectrum of 1kHz sinewave, DC–10kHz, at 8Wpc into 8 ohms (left channel blue, right red, linear frequency scale).
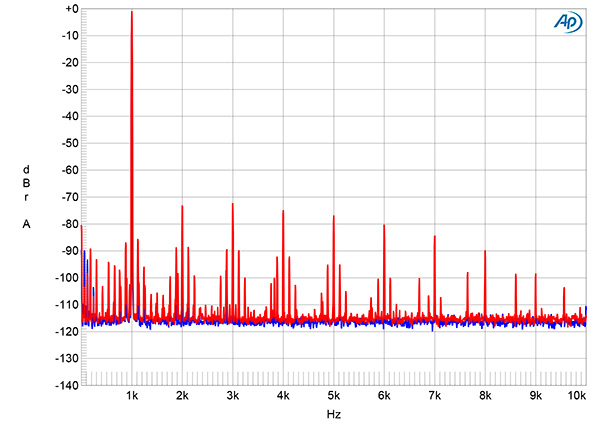
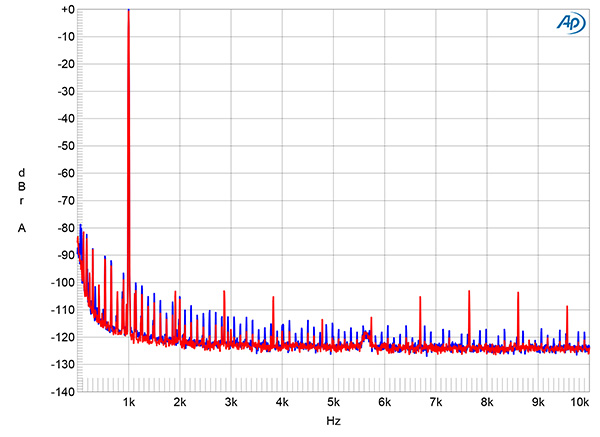
Fig.10 Fern & Roby Amp No.2, spectrum of 1kHz sinewave, DC–10kHz, at 10Wpc into 8 ohms (left channel blue, right red, linear frequency scale).
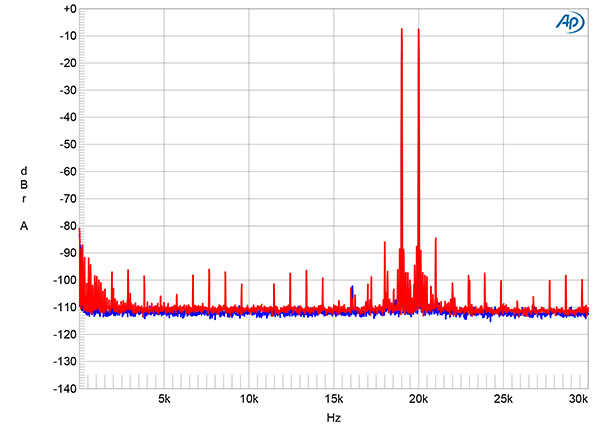
Fig.11 Fern & Roby Amp No.2, HF intermodulation spectrum, DC–30kHz, 19+20kHz at 10Wpc peak into 4 ohms (left channel blue, right red, linear frequency scale).
The THD+N waveform at 8W into 8 ohms (fig.8) was dominated by noise, with the third harmonic the highest in level at –89dB (0.003%; fig.9). However, in addition to the expected supply-related spuriae in this graph, low-level tones are present that are not harmonically related to the input signal; these appear to lie at multiples of 952Hz. When the power is increased slightly to 10Wpc into 8 ohms (fig.10), the second and higher-order harmonics make an appearance (footnote 1). Note that low-level supply-related sidebands are now present around the fundamental and each harmonic. Intermodulation distortion with an equal mix of 19kHz and 20kHz tones peaking at 16W into 4 ohms was very low (fig.11). The second-order difference product at 1kHz was buried beneath the noisefloor, and the higher-order products at 18kHz and 21kHz lay at just –86dB (0.005%).
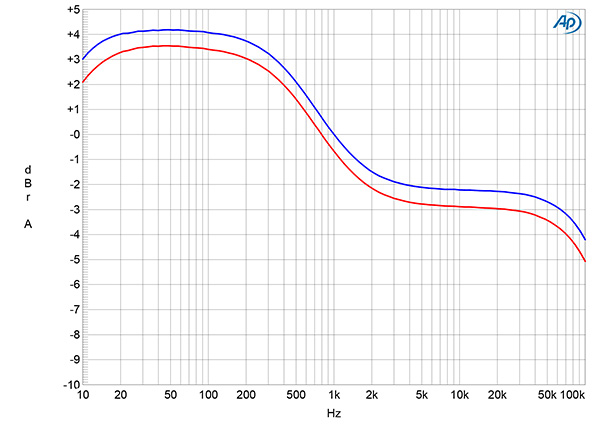
Fig.12 Fern & Roby Amp No.2, phono input, MM mode, response with RIAA correction (left channel blue, right red) (1dB/vertical div.).
The phono input's RIAA-corrected response (fig.12) was identical in both MC and MM modes and was slightly better matched between the channels than the line input response. It featured a 4dB boost in the bass and a 2dB cut in the treble, both of which would be very audible. The high frequencies were extended to well above the audioband, but as with the line inputs, reducing the volume control setting rolled off the output above 20kHz. Channel separation was 60dB or greater below 4kHz and 46dB at 20kHz. In MM mode, the wideband, unweighted S/N ratio, ref. 1kHz at 5mV, assessed with the input shorted to ground, was a good 67dB in both channels. Restricting the measurement bandwidth to 22Hz–22kHz increased the ratio to 73.5dB, while inserting an A-weighting filter gave a further increase to 81.5dB. The ratios were around 12dB lower in MC mode, but this is still a relatively low level of noise.
Fig.13 Fern & Roby Amp No.2, phono input, MM mode, spectrum of 1kHz sinewave, DC–1kHz, for 10mV input with volume control set to –20dB (left channel blue, right red, linear frequency scale).
To be sure I wasn't prematurely clipping the output, I examined the phono input's overload margins with the volume control set to –20dB. The margins were high in both modes from 20Hz to 20kHz, at 22dB ref. 1kHz at 5mV (MM) and 500µV (MC). The third harmonic was the highest in level in the phono input's distortion signature (fig.13), but at –104dB (0.006%) was inconsequential. However, the low-level enharmonic spuriae I noted earlier are also present in this graph. The levels of the intermodulation products with an equal mix of 19 and 20kHz tones were very low.
In some respects, like the low levels of harmonic and intermodulation distortion, Fern & Roby Audio's Amp No. 2 offered respectable measured performance. The amplifier also met its output power specification, which is only specified into 8 ohms. However, the level mismatch between the channels concerned me, as did the relationship between the ultrasonic rolloff and the setting of the volume control and the presence of those low-level enharmonic tones. And then there's that unflat RIAA correction, the least accurate I have measured over decades.—John Atkinson
Footnote 1: These harmonics may be related to the fact that at these powers, the amplifier is no longer fully biased into class-A.


