Sidebar 3: Measurements
I used DRA Labs' MLSSA system and a calibrated DPA 4006 microphone to measure the Dynaudio Confidence 30's frequency response in the farfield, and an Earthworks QTC-40 mike for the nearfield responses. I measured the speaker's impedance with Dayton Audio's DATS v2 system.
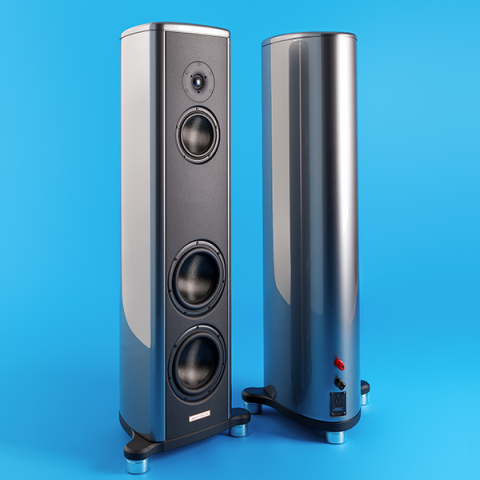
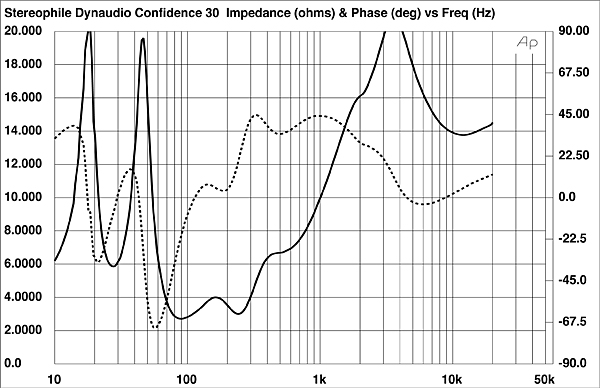
Dynaudio specifies the Confidence 30's sensitivity as 88dB/2.83V/m; my estimate was within experimental error of that figure, at 87.5dB(B)/2.83V/m. The Confidence 30's impedance is specified as 4 ohms with a minimum magnitude of 2.8 ohms at 85Hz. The impedance magnitude (fig.1, solid trace) remains above 8 ohms over most of the audioband; the minimum value is 2.7 ohms between 88Hz and 92Hz. The electrical phase angle (dashed trace) is occasionally high, which means that the EPDR (footnote 1) drops below 2 ohms between 53Hz and 101Hz and between 228Hz and 372kHz. The minimum EPDR value is 1 ohm from 68Hz to 80Hz and 1.28 ohms at 279Hz. The Confidence 30 should be used with amplifiers that don't have problems driving impedances of 4 ohms or lower. The shape of the impedance magnitude trace suggests that the Dynaudio's high frequencies will be emphasized if the loudspeaker is used with tube amplifiers that have a high output impedance.

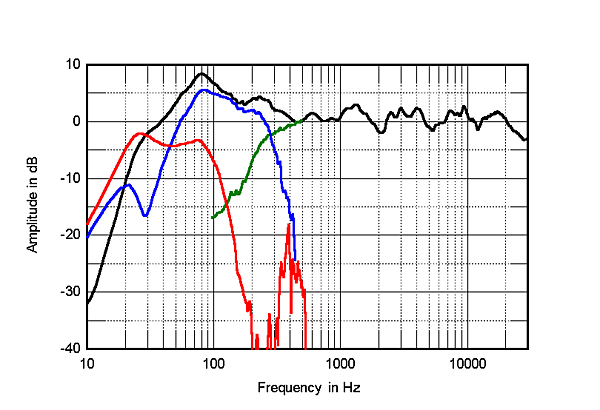 The black trace below 300Hz in fig.3 is the complex sum of the nearfield midrange, woofer, and port responses. The peak in the upper bass will be due in part (6dB) to the nearfield measurement technique, which assumes that the baffle extends to infinity in the vertical and horizontal planes. However, while the Dynaudio speaker offers extended low frequencies, those low frequencies are a little elevated in absolute terms. The Confidence 30's farfield response, averaged across a 30° horizontal window centered on the tweeter axis (footnote 2, fig.3, black trace above 300Hz), is even to the top of the audioband, with small dips balanced by small peaks. This graph was taken without the grille; repeating it with the grille in place depressed the loudspeaker's output between 3kHz and 5kHz by 1–2dB.
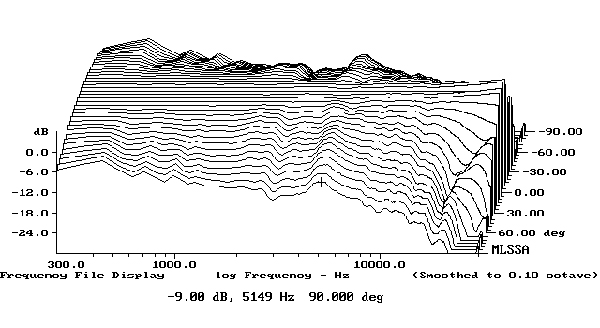
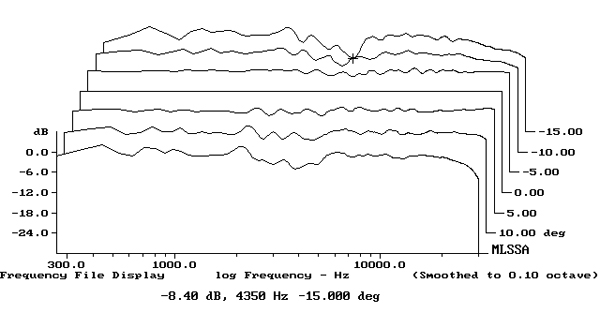
Fig.4 shows the Confidence 30's horizontal radiation pattern, normalized to the response on the tweeter axis, which thus appears as a straight line. The contour lines in this graph are even and reveal a well-controlled dispersion below the top audio octave, both of which correlate with accurate, stable stereo imaging. This graph also reveals that the small dip at 5kHz and the slight excess of energy below that frequency in the on-axis response flatten out to the speaker's sides. This suggests that experimentation with toe-in should allow for a neutral treble balance. In the vertical plane (fig.5), a suckout develops 10° above the tweeter axis, which represents what will be heard by a standing listener. However, the response 5° below the tweeter axis, which is what a seated listener will typically hear, is basically identical to the behavior on the tweeter axis.
The black trace below 300Hz in fig.3 is the complex sum of the nearfield midrange, woofer, and port responses. The peak in the upper bass will be due in part (6dB) to the nearfield measurement technique, which assumes that the baffle extends to infinity in the vertical and horizontal planes. However, while the Dynaudio speaker offers extended low frequencies, those low frequencies are a little elevated in absolute terms. The Confidence 30's farfield response, averaged across a 30° horizontal window centered on the tweeter axis (footnote 2, fig.3, black trace above 300Hz), is even to the top of the audioband, with small dips balanced by small peaks. This graph was taken without the grille; repeating it with the grille in place depressed the loudspeaker's output between 3kHz and 5kHz by 1–2dB.
Fig.4 shows the Confidence 30's horizontal radiation pattern, normalized to the response on the tweeter axis, which thus appears as a straight line. The contour lines in this graph are even and reveal a well-controlled dispersion below the top audio octave, both of which correlate with accurate, stable stereo imaging. This graph also reveals that the small dip at 5kHz and the slight excess of energy below that frequency in the on-axis response flatten out to the speaker's sides. This suggests that experimentation with toe-in should allow for a neutral treble balance. In the vertical plane (fig.5), a suckout develops 10° above the tweeter axis, which represents what will be heard by a standing listener. However, the response 5° below the tweeter axis, which is what a seated listener will typically hear, is basically identical to the behavior on the tweeter axis.
Footnote 1: EPDR is the resistive load that gives rise to the same peak dissipation in an amplifier's output devices as the loudspeaker. See "Audio Power Amplifiers for Loudspeaker Loads," JAES, Vol.42 No.9, September 1994, and stereophile.com/reference/707heavy/index.html.
Footnote 2: As the Confidence 30's on-line manual doesn't mention the preferred listening axis, I used the tweeter axis, which is 41" from the floor, as the reference for the measurements.
Fig.1 Dynaudio Confidence 30, electrical impedance (solid) and phase (dashed) (2 ohms/vertical div.).
The traces in fig.1 are free from the small discontinuities that would imply panel resonances. When I investigated the elegantly curved enclosure's vibrational behavior with a plastic-tape accelerometer, I found a single resonant mode at 563Hz, on the sidewalls (fig.2) and on the front baffle below the sub baffle that carries the drive-units. As this mode has a relatively high frequency and a high Q (Quality Factor), it is unlikely to have audible consequences.
Fig.2 Dynaudio Confidence 30, cumulative spectral-decay plot calculated from output of accelerometer fastened to center of side panel level with lower woofer (MLS driving voltage to speaker, 7.55V; measurement bandwidth, 2kHz).
The saddle centered on 28Hz in the impedance magnitude trace suggests that this is the tuning frequency of the downward-firing port. Both woofers behave identically, and the minimum-motion notch in their summed output (fig.3, blue trace), which is when the back pressure from the reflex resonance holds the woofer cones still, lies at the same frequency. The woofers' output rolls off rapidly above the 290Hz crossover frequency to the midrange unit (green trace—this trace and that of the woofers' output are truncated at frequencies where the measurement is affected by crosstalk from adjacent drive-units). The port's output (fig.3, red trace) has one peak centered on the tuning frequency and another one and a half times higher. The port's higher-frequency rolloff is clean, though there is some low-level output present between 300Hz and 500Hz. As the port fires downward, this higher-frequency behavior should not be audible.
Fig.3 Dynaudio Confidence 30, anechoic response on tweeter axis at 50", averaged across 30° horizontal window and corrected for microphone response, with the nearfield responses of the midrange unit (green), woofers (blue), and port (red), and the complex sum of the nearfield responses (black), respectively plotted below 500Hz, 450Hz, 525Hz, and 300Hz.
Fig.4 Dynaudio Confidence 30, lateral response family at 50", normalized to response on tweeter axis, from back to front: differences in response 90–5° off axis, reference response, differences in response 5–90° off axis.
Fig.5 Dynaudio Confidence 30, vertical response family at 50", normalized to response on tweeter axis, from back to front: differences in response 15–5° above axis, reference response, differences in response 5–15° below axis.
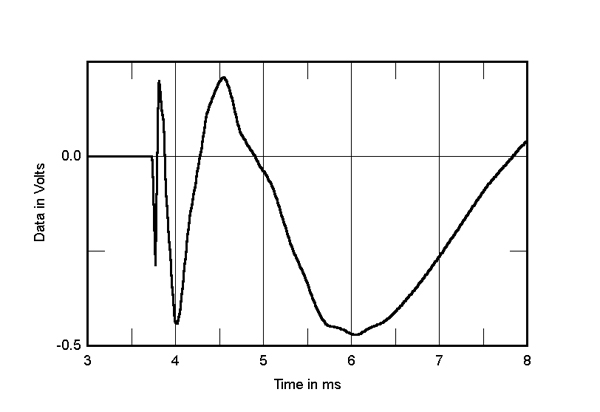
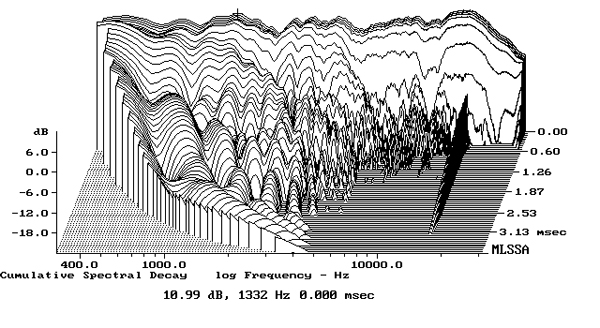
Turning to the time domain, the Confidence 30's step response on the tweeter axis (fig.6) reveals that with the amplifier's positive output connected to the speaker's red binding post, all four drive-units are connected in inverted polarity. (I confirmed this by looking at the step responses of the individual drivers.) The decay of the tweeter's step smoothly blends with the negative-going start of the midrange unit's step and the decay of that driver's step smoothly blends with the start of the woofers' step. This suggests optimal crossover implementation. The Confidence 30's cumulative spectral-decay plot (fig.7) is clean, though some very low-level hash is present in the treble. I suspect that the apparent ridges of low-level decayed energy that can be seen in the upper midrange are due to early reflections of the midrange unit's output. (The very slight discontinuities visible at 5ms and 6ms in the step response imply the existence of reflections.)
Fig.6 Dynaudio Confidence 30, step response on tweeter axis at 50" (5ms time window, 30kHz bandwidth).
Fig.7 Dynaudio Confidence 30, cumulative spectral-decay plot on tweeter axis at 50" (0.15ms risetime).
Overall, Dynaudio's Confidence 30 offers excellent measured performance.—John Atkinson
Footnote 1: EPDR is the resistive load that gives rise to the same peak dissipation in an amplifier's output devices as the loudspeaker. See "Audio Power Amplifiers for Loudspeaker Loads," JAES, Vol.42 No.9, September 1994, and stereophile.com/reference/707heavy/index.html.