| Columns Retired Columns & Blogs |
Cary Audio Design CAD-300SEI integrated amplifier Measurements part 3
Fig.10 plots the 300SEI's distortion against output power into 2 ohms (top trace), 4 ohms (middle trace), and 8 ohms (bottom trace). The "knee" in each curve indicates at what power output (the horizontal scale) the amplifier goes into clipping. In solid-state amplifiers, clipping is often defined as the 1% THD level—or even as 3% THD, if you're generous. But with high-distortion tube amplifiers that may have more than 1% or 3% THD well below clipping, defining when the amplifier actually runs out of power is more difficult. Into a 4 ohm load, for example, the Cary, is producing more than 1% THD at all levels above 1W!
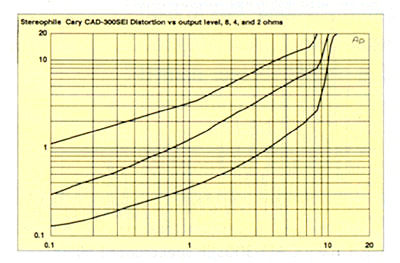
Fig.10 Cary CAD-300SEI, distortion (%) vs output power into (from bottom to top at 10W): 8 ohms, 4 ohms, and 2 ohms.
The 8 ohm curve in fig.10 (lowermost trace) reveals that the 300SEI's distortion shoots up at 8.3W and reaches 10% THD at 10.25W (10.1dBW). I suspect that Cary rates their amplifier outputs at 10% THD. Even using this criterion, the 300SEI didn't quite reach the 11W rated output. The actual clipping powers are shown in Table 1. Note that the maximum output power didn't change with both channels driven: the limiting factor is apparently the 300B output tube, not the 300SEI's power supply.
TABLE 1 Cary CAD-300SEI Clipping (10% THD+N at 1kHz)
| Both Channels Driven | One Channel Driven | ||
| Load | W (dBW) | W (dBW) | |
| ohms | (L) | (R) | (R) |
| 8 | 10.25 (10.1) | 10.25 (10.1) | 10.25 (10.1) |
| (line) | 113V | 113V | 113V |
| 4 | 9 (6.5) | 9 (6.5) | 9 (6.5) |
| (line) | 113V | 113V | 113V |
| 2 | 4.3 (0.34) | ||
| (line) | 113V | ||
Note that when a solid-state amplifier clips, the waveform tops and bottoms are instantly flattened, which creates a whole spectrum of very nasty odd-order harmonic-distortion components. A solid-state amplifier in clipping sounds most unpleasant. Conversely, a tube amplifier—particularly a single-ended tube amplifier—tends to more gently squash the waveform peaks rather than sheer them off. A tube amplifier in clipping therefore sounds much less objectionable musically.
This situation has an analog in recording. Digital recording has an absolute limit (when the system runs out of bits) that, if exceeded, produces a horrible crunching sound. On the other hand, magnetic tape in an analog tape recorder driven into saturation compresses the signal, rolls off the upper treble, and adds some harmonic distortion. You can hear the overload, but it isn't a catastrophic failure. Indeed, some recording engineers deliberately saturate analog tape to soften the sound.
Going back to the 300SEI, I suspect its graceful clipping and the low-order nature of its distortion let it get away with being driven into clipping without severe audible consequences.
The 300SEI's intermodulation spectrum, made by driving the amplifier with a combination of 19kHz and 20kHz tones at 6W into 4 ohms (fig.11), showed a very high level of intermodulation distortion. You can see the entire series of IMD products, spaced at 1kHz across the band. The IMD spectrum when driving an 8 ohm load (not shown) revealed a similar-looking spectrum, but with the distortion products about 5-10dB lower in level. This behavior is undoubtedly audible.
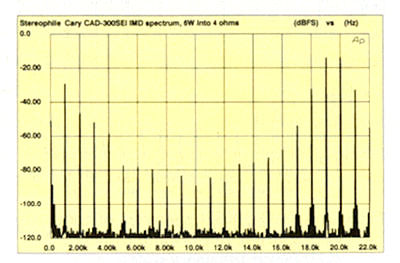
Fig.11 Cary CAD-300SEI, HF intermodulation spectrum, DC-22kHz, 19+20kHz at 6W into 4 ohms (linear frequency scale).
Looking next at the 300SEI's reproduction of a 1kHz squarewave at a power level of around 1W into 8 ohms (fig.12), we can see just a hint of overshoot but a generally excellent shape. When driving the simulated loudspeaker load (fig.13), the squarewave has an odd shape that looks like a damped oscillation. The reactive nature of the simulated loudspeaker load gives the 300SEI more problems than does a simple resistive load. A 10kHz squarewave, again at 1W into 8 ohms (not shown) featured rounded edges associated with the 300SEI's limited HF response, which we saw earlier in the small-signal frequency-response curves (a -3dB point at 30kHz into 4 ohms).
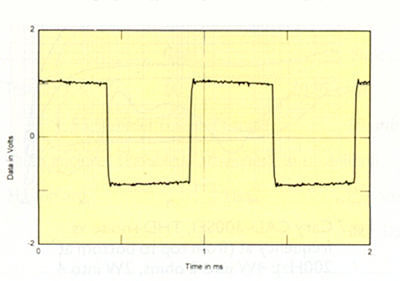
Fig.12 Cary CAD-300SEI, small-signal 10kHz squarewave into 8 ohms.
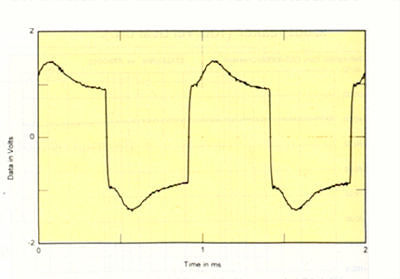
Fig.13 Cary CAD-300SEI, small-signal 10kHz squarewave into simulated loudspeaker load.
These squarewave responses, along with fig.1 (small-signal frequency response) and fig.4 (THD+N vs frequency), suggest that the 300SEI will work best with a high-impedance loudspeaker that maintains a nearly constant impedance across the band, and one having no severe phase-angle swings. The more like a resistor the loudspeaker appears to the 300SEI, the better the Cary will perform. [Headphones, for example, which feature a high, almost resistive impedance across the entire audioband, represent an ideal load for the Cary.—Ed.]
A joke?
I could be kind and use the phrase "less than ideal" to describe the 300SEI's technical performance. But I'll tell it like it is: this amplifier measures so poorly it's a joke. The large (more than 4dB) frequency-response aberrations when driving a reactive load, ridiculously high output impedance (more than 4 ohms), ultrahigh distortion levels, and severely limited output power are all contrary to what we consider good technical performance.
I can easily imagine the non-listening audio-engineering community looking at these measurement results and laughing at audiophiles who must "like the sound of distortion." But after close critical scrutiny—both in the listening room and the test lab—I'm convinced that the 300SEI doesn't harm the signal in some of the ways push-pull amplifiers do, and that what the 300SEI does right is beyond the ability of today's traditional measurements to quantify. Further, I didn't enjoy the 300SEI so much musically merely because it introduced frequency-response deviations and added lots of low-order harmonic distortion. Instead, the 300SEI's fundamental musical rightness overcame its limitations.—Robert Harley
- Log in or register to post comments
