| Columns Retired Columns & Blogs |
Cary Audio Design CAD-300SEI integrated amplifier Measurements part 2
I'm certain, however, that the 300SEI's treble smoothness and liquidity were not solely the result of this treble attenuation. If you roll off a grainy treble, the grain may be less offensive, but the grain is still present.
The 300SEI's crosstalk is shown in fig.5. The amplifier measured a straight 40dB of channel separation across the audioband—mediocre performance at best. This poor measured separation may have been due to noise as the signal/noise ratio was also less than impressive. It measured 72dB (left channel) and 66dB (right channel) unweighted over a 22Hz-22kHz bandwidth, referenced to 2.83V output (1W into 8 ohms) and with the input shorted. These figures improved with A-weighting to 86.7dB (left) and 81.7dB (right). The large improvement in signal/noise ratio gained by A-weighting the measurement suggests that the noise is low in frequency. (Weighting curves roll off the frequency extremes to simulate the ear's reduced sensitivity at those frequencies.)
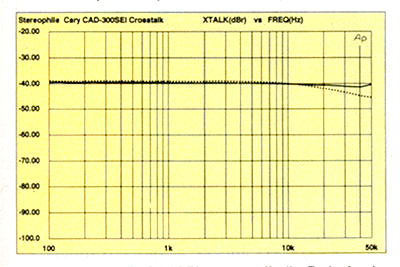
Fig.5 Cary CAD-300SEI, crosstalk (L-R dashed, 10dB/vertical div.).
To investigate further, I performed an FFT-derived spectrum analysis on the 300SEI's output with the amplifier's input shorted and the volume set to the maximum (fig.6). (The 0dB reference in this graph is 2.83V into 8 ohms.) The spikes at 60Hz and its harmonics indicate that the 300SEI's noise is mostly power-supply related. Even with the ultrasensitive Compositions, I heard no noise from the loudspeakers with the 300SEI connected to them and no music playing.
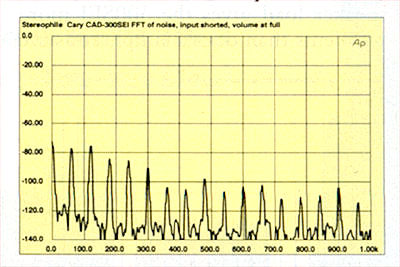
Fig.6 Cary CAD-300SEI, spectrum of noise, input shorted, ref. 1W into 8 ohms DC-1kHz (linear frequency scale).
The THD+noise vs frequency curves (fig.7) show the 300SEI to have high distortion, particularly when driving low impedance loads. The curves were made, from top to bottom at 1kHz, with the 300SEI driving 4W into 2 ohms, 2W into 4 ohms, 1W into the simulated loudspeaker load, and 1W into the 8 ohm resistive load. With a 2 ohm load, the 300SEI produced a whopping 10% THD! With an 8 ohm loudspeaker, the 300SEI's distortion averaged less than 1% across the band. These curves highlight just how important it is to choose a loudspeaker with a highish impedance for use with a single-ended tube amplifier such as the 300SEI.

Fig.7 Cary CAD-300SEI, THD+noise vs frequency at (from top to bottom at 200Hz): 4W into 2 ohms, 2W into 4 ohms, 1W into 8 ohms, and 2.83V into dummy load (right channel dashed).
It's a common mistake to consider a single THD figure an indicator of distortion audibility. The THD+N figures in the previous graph sum all harmonics and noise for a single figure and ignore which harmonics are present and in what ratios. As you can demonstrate for yourself with the second Stereophile Test CD, 0.3% of seventh-harmonic distortion is more annoying than 10% of second-harmonic distortion. Generally, lower-order harmonics are less audible, as are even-order harmonics (second, fourth, sixth). The most benign harmonic distortion is thus second-harmonic.
With that in mind, look at fig.8, an FFT-derived spectrum of the 300SEI's output when reproducing a 50Hz sinewave at 6W (2/3 power) into 4 ohms. The FFT shows the fundamental test tone at 50Hz, along with the individual harmonic-distortion components created by the 300SEI. The second harmonic is dominant, followed by the third, and so forth. The nasty-sounding odd-order fifth and ninth harmonics are suppressed in relation to the other distortion products. Because the distortion is primarily low-order, the 300SEI can get away with having several-percent THD. [While the distortion will be audible, it will be relatively musically consonant, which is not the same thing as being inaudible.—Ed.]
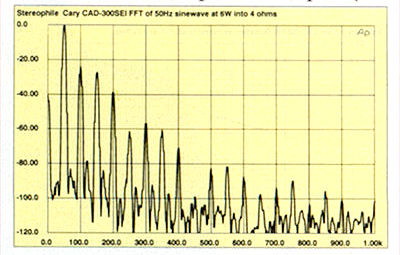
Fig.8 Cary CAD-300SEI, spectrum of 50Hz sinewave, DC-1kHz, at 6W into 4 ohms (linear frequency scale). Note that the second harmonic at 100Hz is the highest in level, at -26dB (5%)!
Another way of looking at an amplifier's distortion is to notch out the test-signal frequency and capture the remaining signal (the distortion) with a digital storage oscilloscope. Fig.9 is such a plot, with the test signal shown at the top and the distortion residue at the bottom. The trace shows the low-order nature of the 300SEI's distortion.
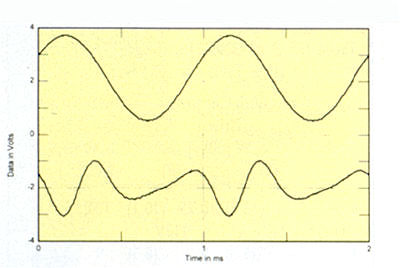
Fig.9 Cary CAD-300SEI, 1kHz waveform at 1W into 8 ohms (top); distortion and noise waveform with fundamental notched out (bottom).
- Log in or register to post comments
