Sidebar 3: Measurements
For logistical reasons, I measured a different sample (serial number 0384) from those auditioned by Brian Damkroger. Except when stated otherwise, the measurements were performed with the grille removed. Also, to avoid the possibility of damaging the cabinet's finish, I did not remove its protective film (footnote 1). I used DRA Labs' MLSSA system and a calibrated DPA 4006 microphone to measure the Wilson SabrinaX's frequency response in the farfield, and an Earthworks QTC-40 for the nearfield responses of the individual drive-units.
When I measure a loudspeaker, I usually raise it so that its tweeter is midway between the floor and ceiling, which maximizes the anechoic time window for the farfield measurements. However, because the SabrinaX's enclosure is constructed from Wilson's proprietary and very dense X material, the 112lb loudspeaker was too heavy for me to lift as high as I would have liked. I therefore had to use more aggressive windowing of the impulse response than usual when calculating the frequency response and cumulative spectral decay plot.
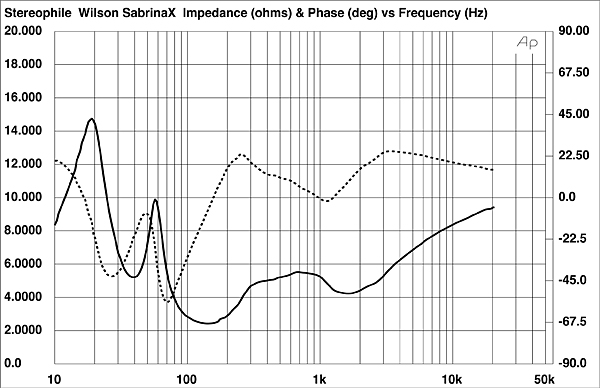
The SabrinaX's voltage sensitivity is specified as 87dB/W/m at 1kHz. My estimate with white noise was a little higher, at 89dB(B)/2.83V/m, which is close to the 88.2dB(B) I measured for the original Sabrina that Robert Deutsch reviewed in 2016. The solid trace in fig.1, taken with Dayton Audio's DATS V2 system, shows how the SabrinaX's impedance magnitude varies with frequency. It is very similar to that of the 2016 Sabrina and remains above 4 ohms for much of the audioband. The impedance is lower between 80Hz and 260Hz, with a minimum value of 2.43 ohms at 144Hz, and the speaker's electrical phase angle (fig.1, dashed trace) is high in the midbass. I used the formula in a 1994 JAES paper to calculate the "equivalent peak dissipation resistance" (EPDR, footnote 2). The SabrinaX has an EPDR of less than 2 ohms between 65Hz and 275Hz, with a minimum value of 1.1 ohms at 90Hz, where music can have high energy. The partnering amplifier needs to be capable of driving 2 ohms without stress.
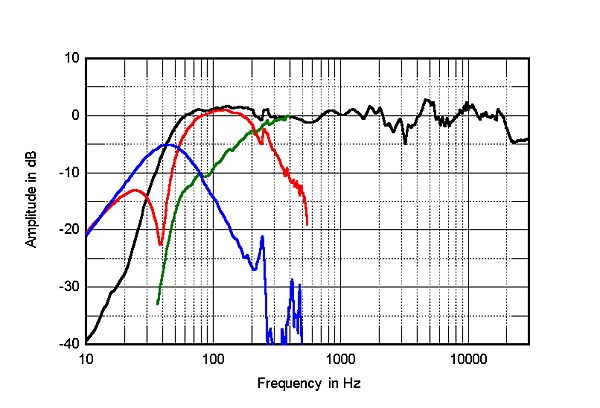
 The Wilson's port is tuned to 38Hz, confirmed by the minimum-motion notch at that frequency in the woofer's nearfield output (fig.3, red trace). The port's nearfield response (blue trace) peaks between 25 and 75Hz, and though some peaks are present in its higher-frequency output, these are well down in level. The midrange unit (green trace) appears to cross over to the woofer just above 200Hz. (Note that I have cut off the woofer's upper-frequency trace and the midrange unit's lower-frequency trace because the measured outputs in the deleted regions were affected by crosstalk.) The complex sum of the nearfield response, taking into account acoustic phase and the fact that the port is mounted on the speaker's rear, is shown as the black trace below 312Hz in fig.3. There is very little of the upper-bass boost that usually results from nearfield measurements. This suggests that the SabrinaX's low-frequency alignment is optimized for clarity and definition with the bass then reinforced by the low-frequency "room gain."
Footnote 1: One anomaly I found when I unpacked the SabrinaX was that even with the loudspeaker not connected to an amplifier, I could hear a very low-level hum coming from the midrange unit. The level of this hum varied with the position in the room and the orientation of the loudspeaker. The hum frequencies were primarily 180Hz and 300Hz. All I can conjecture is that the iron, steel, or ferrite core of an inductor in the midrange crossover circuit was picking up the hum field from my home's AC wiring. When the speaker is connected to an amplifier, the latter's very low output impedance should damp the hum. This is more a curiosity than a concern. Footnote 2: EPDR is the resistive load that gives rise to the same peak dissipation in an amplifier's output devices as the loudspeaker. See "Audio Power Amplifiers for Loudspeaker Loads" by Eric Benjamin, JAES, Vol.42 No.9, September 1994, and Keith Howard's article here.
Fig.1 Wilson SabrinaX, electrical impedance (solid) and phase (dashed) (2 ohms/vertical div.).
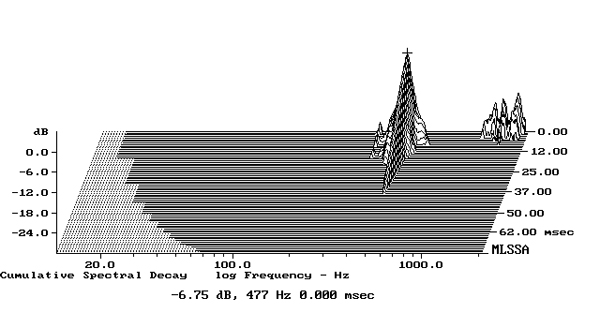
Cumulative spectral-decay plots of the cabinet walls' vibrational behavior, calculated from the output of a plastic-tape accelerometer, confirmed that the enclosure was relatively inert (fig.2). The only significant resonant mode, present on the sidewalls level with both the midrange unit and the woofer, lay at 477Hz, but its high Q (Quality factor) will work against it having audible consequences. The use of X material has indeed improved the enclosure's resonant behavior compared with that of the original Sabrina.
Fig.2 Wilson SabrinaX, cumulative spectral-decay plot calculated from output of accelerometer fastened to center of side panel level with woofer (MLS driving voltage to speaker, 7.55V; measurement bandwidth, 2kHz).
Interestingly, the back panel level with the woofer seemed livelier with a knuckle-rap test than I was expecting, but I couldn't detect any resonances below 700Hz with the accelerometer. This is presumably because the modes are much higher in frequency than the woofer's passband and so won't be excited by music.
Fig.3 Wilson SabrinaX, anechoic response on HF axis at 50", averaged across 30° horizontal window and corrected for microphone response, with nearfield responses of midrange unit (green), woofer (red), and port (blue), and their complex sum (black), respectively plotted below 312Hz, 550Hz, 500Hz, and 312Hz.
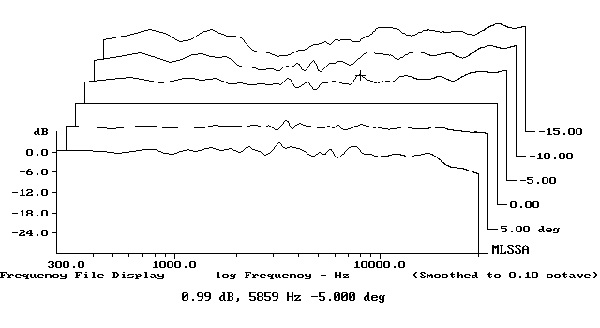
The SabrinaX's farfield output, taken without the grille and averaged across a 30° horizontal window centered on the tweeter axis (fig.3, black trace above 312Hz), is even from the lower midrange through the high treble, with small peaks balanced by small dips. (Repeating the measurement with the grille made very little difference to this response.) There is a broad but shallow depression in the presence region, but the plot of the Wilson's horizontal dispersion (fig.4) indicates that this depression fills in to the speaker's sides. Experimenting with toe-in will optimize the SabrinaX's treble balance. In the vertical plane (fig.5), the speaker's tweeter-axis balance is maintained over a wide ±10° angle.
Fig.4 Wilson SabrinaX, lateral response family at 50", normalized to response on tweeter axis, from back to front: differences in response 90–5° off axis, reference response, differences in response 5–90° off axis.
Fig.5 Wilson SabrinaX, vertical response family at 50", normalized to response on tweeter axis, from back to front: responses 15–5° above axis, reference response, responses 5–10° below axis.
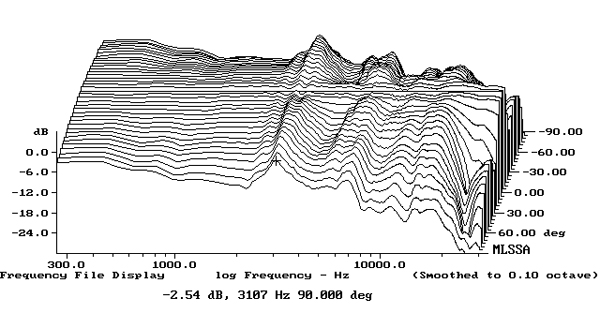
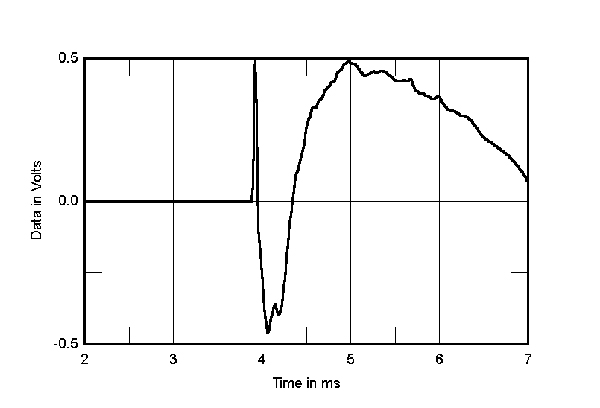
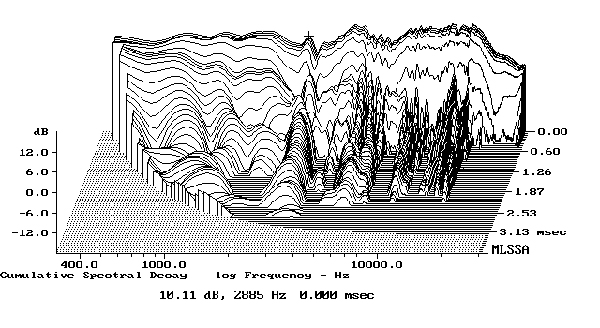
In the time domain, the SabrinaX's step response on the tweeter axis (fig.6) is identical to that of the other Wilson designs that we have reviewed in recent years. The tweeter's positive-polarity output arrives first at the microphone, and the decay of its step smoothly blends with the start of the midrange unit's negative-polarity step. Similarly, the decay of the midrange unit's step smoothly blends with the start of the woofer's positive-polarity step. In conjunction with the speaker's slightly sloped-back front baffle, this smooth blending implies optimal crossover design. Some small ripples in the step response correlate with a ridge of delayed energy just below 3kHz in the SabrinaX's cumulative spectral-decay plot on the tweeter axis (fig.7). (Ignore the black ridge of delayed energy just below 16kHz in this graph, which is due to interference from the computer's video-display circuitry.)
Fig.6 Wilson SabrinaX, step response on HF axis at 50" (5ms time window, 30kHz bandwidth).
Fig.7 Wilson SabrinaX, cumulative spectral-decay plot on HF axis at 50" (0.15ms risetime).
As with the original Sabrina, the SabrinaX's measured performance suggests that the design has been carefully optimized.—John Atkinson
Footnote 1: One anomaly I found when I unpacked the SabrinaX was that even with the loudspeaker not connected to an amplifier, I could hear a very low-level hum coming from the midrange unit. The level of this hum varied with the position in the room and the orientation of the loudspeaker. The hum frequencies were primarily 180Hz and 300Hz. All I can conjecture is that the iron, steel, or ferrite core of an inductor in the midrange crossover circuit was picking up the hum field from my home's AC wiring. When the speaker is connected to an amplifier, the latter's very low output impedance should damp the hum. This is more a curiosity than a concern. Footnote 2: EPDR is the resistive load that gives rise to the same peak dissipation in an amplifier's output devices as the loudspeaker. See "Audio Power Amplifiers for Loudspeaker Loads" by Eric Benjamin, JAES, Vol.42 No.9, September 1994, and Keith Howard's article here.


