Sidebar 3: Measurements
I used DRA Labs' MLSSA system, a calibrated DPA 4006 microphone, and an Earthworks microphone preamplifier to measure the PS Audio Aspen FR5's quasi-anechoic frequency- and time-domain behavior in the farfield. I used an Earthworks QTC-40 microphone for the nearfield responses and Dayton Audio's DATS V2 system to measure the impedance magnitude and phase.
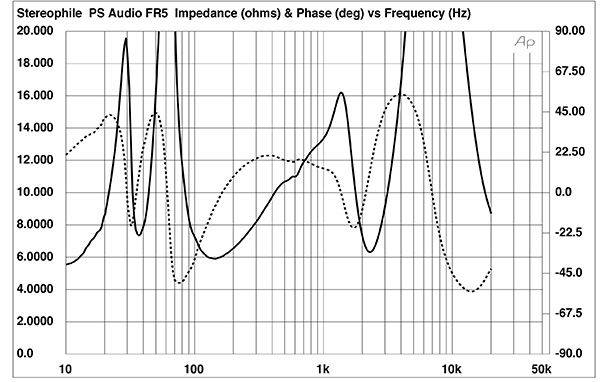
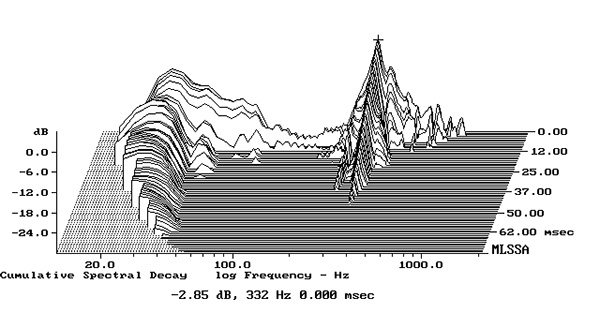
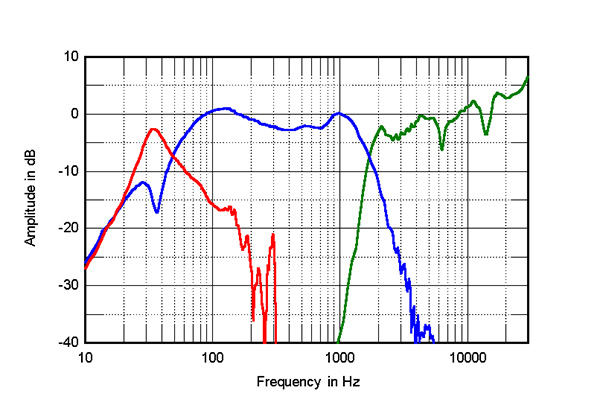
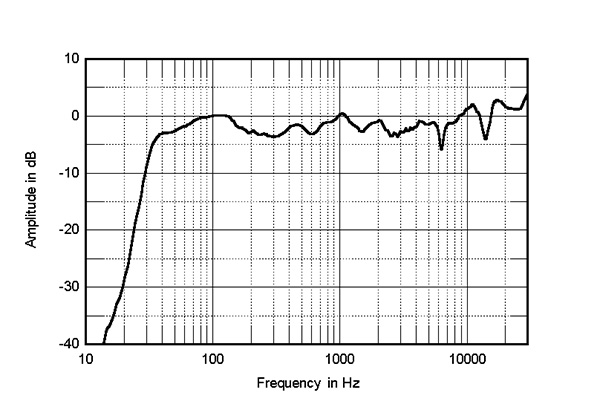
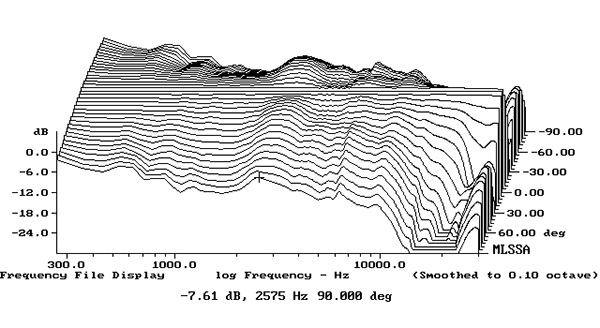
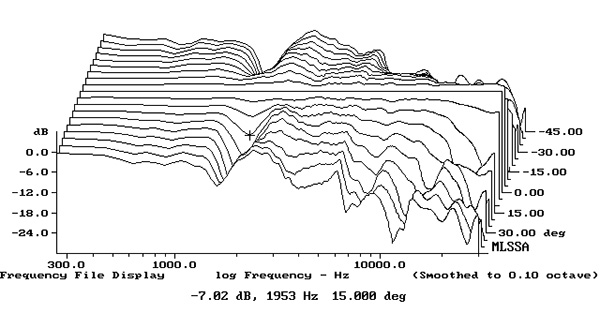
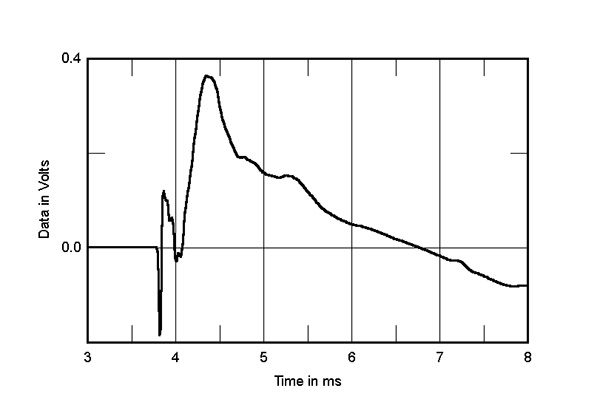
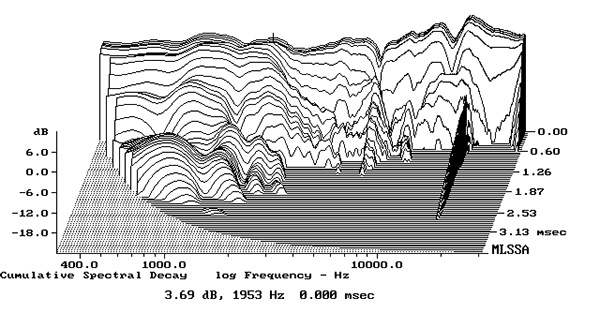
Fig.8 PS Audio Aspen FR5, cumulative spectral-decay plot on tweeter axis at 50" (0.15ms risetime).
In the time domain, the PS Audio's step response on the tweeter axis (fig.7) shows that the tweeter is connected in inverted acoustic polarity, the woofer in positive polarity. The tweeter's output arrives first at the microphone, with the decay of its step blending with the start of the woofer's step. Other than a small ridge of delayed energy at 7kHz, the Aspen FR5's cumulative spectral-decay, or waterfall, plot (fig.8) is clean in the tweeter's passband. (As always, ignore the ridge of delayed energy close to 16kHz in this graph, which is due to interference from the measurement computer's video circuitry.) There is also some delayed energy present in the upper midrange, this associated with the slight on-axis peak at the top of the woofer's passband.
The PS Audio Aspen FR5's measured performance suggests that with care taken in setup and system matching, it should give musically satisfying sound.—John Atkinson
Footnote 1: EPDR is the resistive load that gives rise to the same peak dissipation in an amplifier's output devices as the loudspeaker. See "Audio Power Amplifiers for Loudspeaker Loads," JAES, Vol.42 No.9, September 1994, and stereophile.com/reference/707heavy/index.html.
Fig.1 PS Audio Aspen FR5, electrical impedance (solid) and phase (dashed) (2 ohms/vertical div.).
PS Audio specifies the Aspen FR5's voltage sensitivity as 83.5dB/2.83V/m; my estimate was slightly lower, at 82.6dB(B)/2.83V/m, the same as my Rogers LS3/5a. The Aspen FR5's nominal impedance is specified as 6 ohms, with a minimum value of 5.6 ohms. The impedance magnitude (fig.1, solid trace) was higher than 6 ohms over almost the entire audioband; the minimum impedance was 5.89 ohms at 144Hz. This suggests that the FR5 will be an easy load for the partnering amplifier. However, the electrical phase angle (fig.1, dotted trace) is high in several frequency regions; as a result, the effective resistance, or EPDR (footnote 1), drops below 4 ohms from 39Hz to 46Hz, from 78Hz to 139Hz, and from 2.78kHz to 3.75kHz. The minimum EPDR values are 3.5 ohms at 43Hz, 2.6 ohms at 96Hz, and 2.78 ohms at 2.8kHz. The Aspen FR5 needs to be partnered with an amplifier that doesn't have a problem driving low impedances, and this will be exacerbated by the speaker's low sensitivity.
Fig.2 PS Audio Aspen FR5, cumulative spectral-decay plot calculated from output of accelerometer fastened to the center of a sidewall (MLS driving voltage to speaker, 7.55V; measurement bandwidth, 2kHz).
The enclosure emitted a quiet "bonk" when I rapped its panels with my knuckles. Using both a plastic-tape accelerometer and a piezoelectric acoustic guitar pickup, I found a fairly strong resonant mode at 332Hz on the top and side panels as well as vibrations at the passive radiator's tuning frequency (fig.2). Although the mode at 332Hz has a high Q (Quality Factor), which will work against audibility, its relatively high level and the fact that it lies close to the frequency of the musical note E above Middle C might introduce some coloration in the lower midrange.
Fig.3 PS Audio Aspen FR5, acoustic crossover on tweeter axis at 50", corrected for microphone response, with the nearfield responses of the woofer (blue) and passive radiator (red), respectively plotted below 350Hz and 400Hz.
The saddle centered on 36Hz in the impedance magnitude trace implies that this is the tuning frequency of the "racetrack" passive radiator on the PS Audio's rear panel. The woofer's nearfield response (blue trace below 350Hz in fig.3) had the expected reflex tuning notch at this frequency. The passive radiator's nearfield response (fig.3, red trace) peaks at the tuning frequency before rolling off cleanly at lower and higher frequencies, though some low-level peaks are present in its midrange output. There is a slight peak centered on 1kHz in the woofer's farfield response (blue trace above 350Hz) before it crosses over to the tweeter (green trace) at the specified 1.75kHz. The FR5's manual describes the crossover as 6th-order Linkwitz-Riley acoustic in nature, and the crossover slopes are indeed extremely steep. There is a slight rise above 10kHz in the tweeter's output.
Fig.4 PS Audio Aspen FR5, anechoic response on tweeter axis at 50", averaged across 30° horizontal window and corrected for microphone response, with the nearfield responses of the complex sum of the woofer and passive radiator responses (black) plotted below 300Hz.
The complex sum of the woofer's and passive radiator's nearfield responses (fig.4, black trace below 300Hz) has only a small upper-bass peak due to the nearfield measurement technique, which assumes the baffle extends to infinity in both planes. This suggests that the Aspen FR5's low-frequency alignment is slightly overdamped. However, the low frequencies are well-extended for a fairly small standmount, the output not reaching –6dB until 34Hz.
The PS Audio's farfield response without the grille, averaged across a 30° horizontal window centered on the tweeter axis, is shown as the black trace above 300Hz in fig.4. The response is relatively even through the midrange and treble, with slight depressions balanced by slight peaks. However, depending on which region the ear takes as its reference, which will depend on the music being played, either the lower midrange and presence region might sound depressed or the upper midrange will sound emphasized.
Fig.5 PS Audio Aspen FR5, lateral response family at 50", normalized to response on tweeter axis, from back to front: differences in response 90–5° off axis, reference response, differences in response 5–90° off axis.
Fig.6 PS Audio Aspen FR5, vertical response family at 50", normalized to response on tweeter axis, from back to front: differences in response 45–5° above axis, reference response, differences in response 5–45° below axis.
The PS Audio's horizontal radiation pattern, normalized to the response on the tweeter axis, which therefore appears as a straight line, is shown in fig.5. The slight lack of energy in the presence region tends to fill in to the speaker's sides, though the radiation pattern narrows in the top octave. The manual suggests that the Aspen FR5s be toed-in so that their axes cross about 3' behind the listening position. This will bring the level in the top octave in closer balance with that in the lower treble regions. Fig.6 shows the Aspen FR5's dispersion in the vertical plane, again normalized to the response on the tweeter axis. A suckout in the crossover region develops 20° above the tweeter axis and more than 10° below that axis. This speaker should be used with a stand that places the tweeter axis close to the listener's ears.
Fig.7 PS Audio Aspen FR5, step response on tweeter axis at 50" (5ms time window, 30kHz bandwidth).
Fig.8 PS Audio Aspen FR5, cumulative spectral-decay plot on tweeter axis at 50" (0.15ms risetime).
Footnote 1: EPDR is the resistive load that gives rise to the same peak dissipation in an amplifier's output devices as the loudspeaker. See "Audio Power Amplifiers for Loudspeaker Loads," JAES, Vol.42 No.9, September 1994, and stereophile.com/reference/707heavy/index.html.


