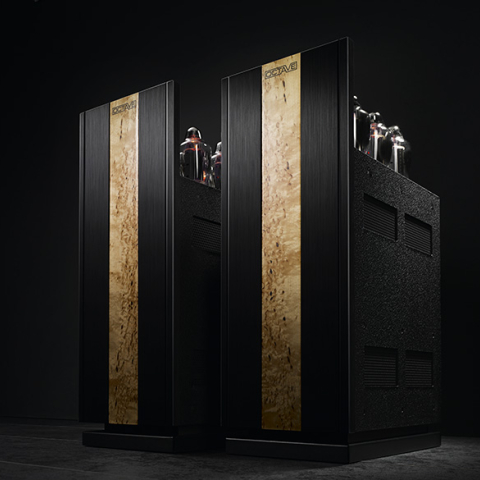
I measured a different sample of the Octave Audio MRE 220 SE to that auditioned by JVS. Mine had the serial number 412182330. JVS had told me that he performed his critical auditioning with the balanced input, the Power switch set to High, the damping factor set to DF Low, the Ground Lift switch in the Connected position, and with the amplifier connected to the Super Black Box external supply (footnote 1). I performed a full set of measurements in that condition, then repeated some of the tests with the single-ended input, then with the damping set to DF High, and finally without the Super Black Box (footnote 2).
The four KT150 output tubes were not marked, but I followed the guide in their box to install them correctly. I let the amplifier warm up for an hour, then followed the instructions in the manual to make sure that the bias was set correctly for each tube. I then started the testing with my Audio Precision SYS2722 system.
The amplifier preserved absolute polarity with both the balanced and unbalanced inputs. With DF Low, the gain into 8 ohms from the single pair of output terminals was 27.5dB for both input types. DF High reduced the gain by 1dB. The balanced input impedance is specified as 50k ohms, which was confirmed by my measurements. The single-ended input's impedance, specified as 25k ohms, was 44k ohms at 20Hz and 1kHz, dropping inconsequentially to 29k ohms at the top of the audioband.
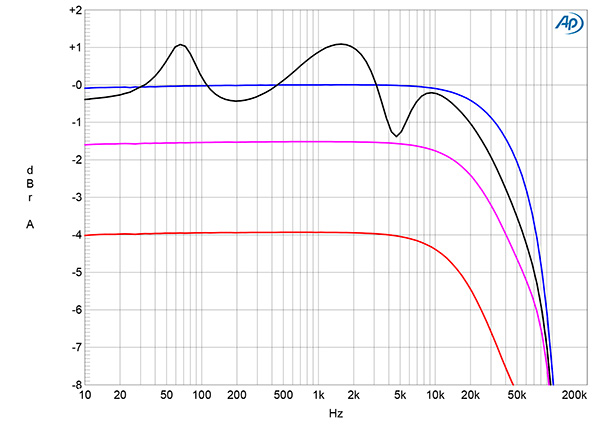
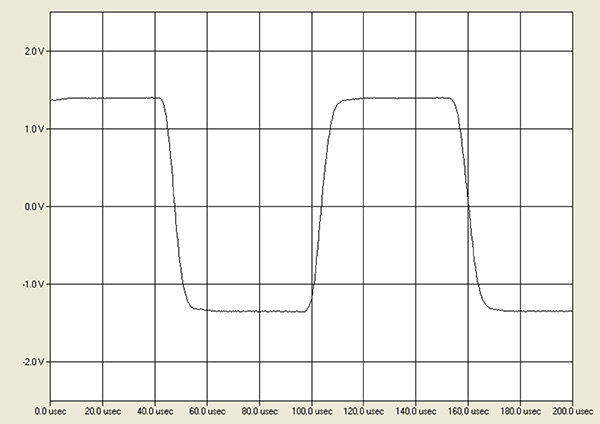
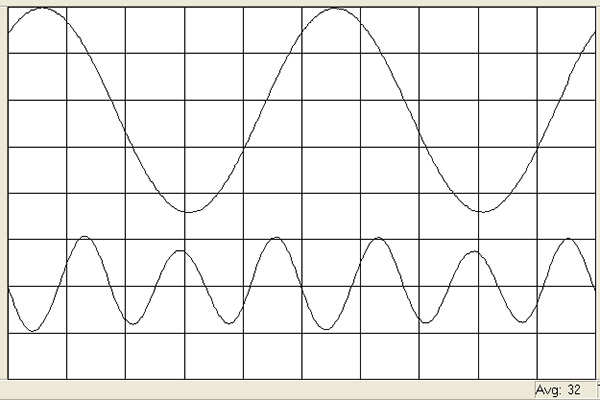
The amplifier's output impedance in DF Low mode, including 6' of spaced-pair speaker cable, was a high 1.87 ohms in the bass and midrange, rising to 2.7 ohms at 20kHz. Consequently, the modulation of the MRE 220 SE's frequency response due to the Ohm's law interaction between this impedance and that of our standard simulated loudspeaker was ±1.1dB (fig.1, gray trace). The amplifier's response into 8 ohms (blue trace) was flat in the audioband, rolling off above 20kHz to reach –3dB at 65kHz. Fig.1 was taken with the balanced input. The response with the unbalanced inputs was very similar, though the –3dB point dropped slightly, to 58kHz. The MRE 220 SE's reproduction of a 10kHz squarewave in DF Low mode was free from overshoot or ringing (fig.2).
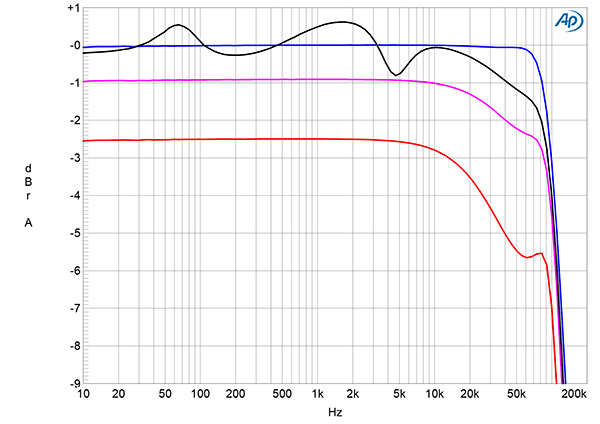
The output impedance in DF High mode was half that in DF Low mode. The modulation of the amplifier's frequency response into the simulated loudspeaker therefore varied by ±0.7dB (fig.3, gray trace). The response in this mode extended significantly higher in frequency into 8 ohms (blue trace), with the output down by 3dB at 100kHz. A small peak at 70kHz started to develop into 2 ohms (red trace), though the output started to roll off much earlier in frequency than into 8 ohms.
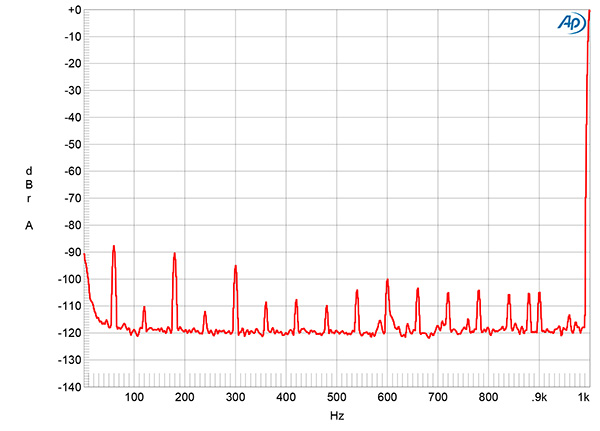
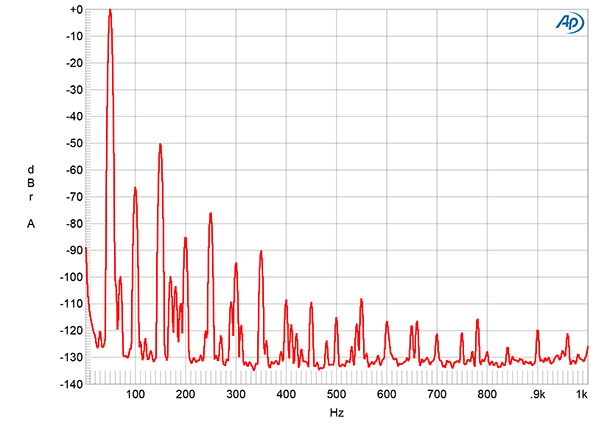
The wideband, unweighted signal/noise ratio, taken with either the balanced input or the unbalanced input shorted to ground and with the Super Black Box supply, was a good 75.7dB ref. 2.83V, which is equivalent to 1W into 8 ohms. This ratio improved slightly, to 77.6dB when the measurement bandwidth was restricted to the audioband, and to 79.1dB when A-weighted. The S/N ratios were very similar without the Super Black Box. Fig.4 shows the spectrum of the amplifier's low-frequency noisefloor at 1Wpc into 8 ohms with the Super Black Box. The level of random noise is low, and while odd-order harmonics of the AC supply frequency are present, presumably due to magnetic interference from the power transformer, these all lie at or below –90dB.
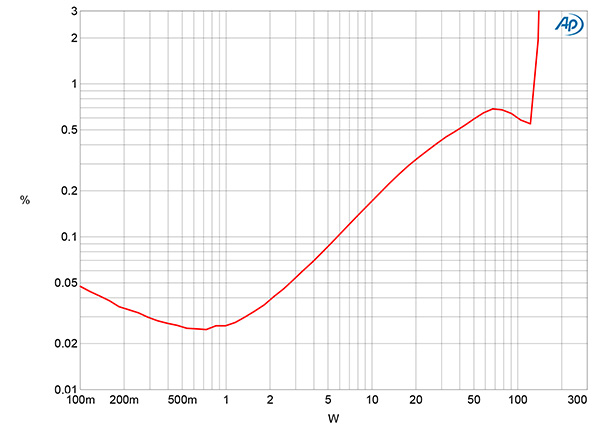
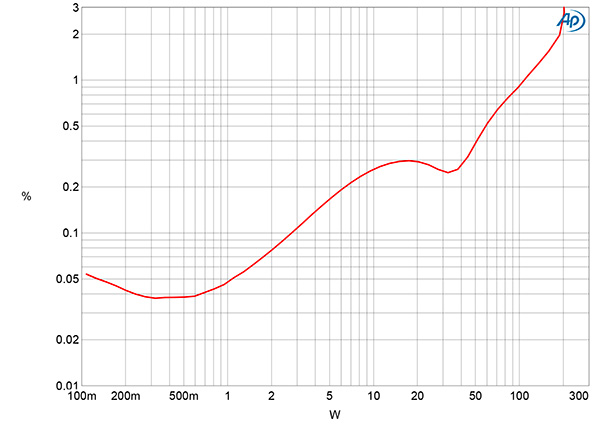
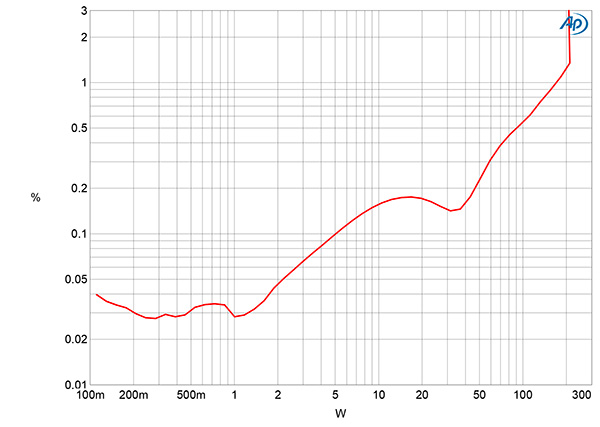
Octave specifies the maximum power with KT150s and the High power setting as 200W into 4 ohms (20dBW), 20% lower into 8 ohms. Fig.5 plots how the THD+noise percentage with the Super Black Box varies with output power into 8 ohms. The THD+N rises with increasing power above 0.7W, reaching 1%, our usual definition of clipping, at 130W (21.1dBW). Fig.6 repeats the THD+N measurement into 4 ohms. The THD+N reaches 1% at 114W (17.56dBW) and 3% at 203W (20.06dBW). The only difference that I noted when I repeated these tests without the Super Black Box was that the maximum power into 4 ohms was 190W at 3% THD+N (19.8dBW). The shapes of the traces with and without the Super Black Box were identical, with the roughly linear increase in THD+N suggesting that the circuit uses little or no global loop feedback. With the damping factor set to High, the maximum power into 4 ohms was the same as with it set to Low. However, the distortion at moderate powers was lower (fig.7).
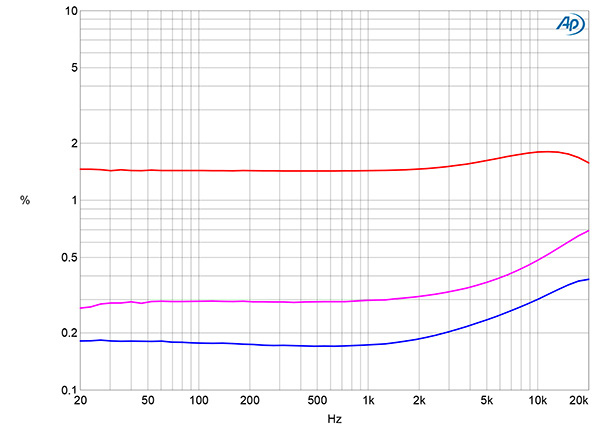
Fig.8 shows how the THD+N percentage changed with frequency at 8.95V, equivalent to 10W into 8 ohms, 20W into 4 ohms, and 40W into 2 ohms. The distortion into 8 ohms (blue trace) is around 0.18% over most of the audioband, with an increase in the top octaves. The THD+N percentage rises to 0.3% into 4 ohms (magenta trace), and to 1.6% into 2 ohms (red trace). Repeating this measurement without the Super Black Box gave an identical result, though with the damping factor set to High, the THD+N into 8 ohms averaged 0.09% in the bass and midrange.
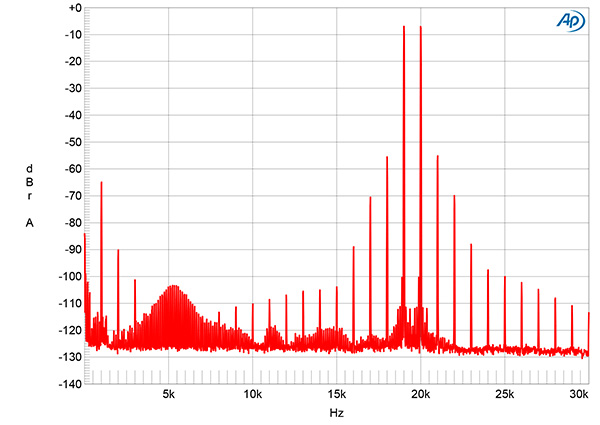
The THD+N waveform at 20W into 8 ohms was primarily the third harmonic (fig.9), at –50dB (0.3%, fig.10), though the second harmonic is also present at –67dB. Even into 4 ohms, the second-order difference product at 1kHz with an equal mix of 19kHz and 20kHz tones was relatively low, at –66dB (0.05%) ref. a peak level of 20W (fig.11). However, the higher-order intermodulation distortion products at 18kHz and 21kHz lay at –56dB (0.15%). There is a peculiar rise in power-supply–related spuriae between 3kHz and 8kHz visible in this graph, though these all lie below –104dB. I repeated the test with the ground connection lifted and with the single-ended input, but this behavior didn't change.
The measured performance of Octave Audio's MRE 220 SE is typical of a tubed amplifier that doesn't use a large amount of corrective loop negative feedback. But the highish level of distortion into 2 ohms, even though it's the relatively innocuous third harmonic, suggests that the amplifier shouldn't be used with loudspeakers whose impedance drops much below 4 ohms.—John Atkinson
Footnote 1: JVS also told me that he had used Octave's in-line Filter 3-P with the balanced input, but I had not been supplied with that for the testing.
Footnote 2: I powered down the MRE 220 SE before disconnecting the Super Black Box, then waited for 30 minutes after powering up the amplifier before repeating the testing. I did the same when changing the damping factor from Low to High.