
Regarding linearity, the MSB was virtually free from harmonic (fig.7) and intermodulation (fig.8) distortion—only when it came to jitter did the processor seem to stumble a little. I assess jitter by driving the device under test with data representing a high-level tone at one quarter the sample rate (11.025kHz), over which has been overlaid the 16th bit toggling on and off at a rate of 229Hz. Using the Paul Miller analyzer, I average sixty-four 32k FFTs on the device's analog output to get a narrow-band spectrum. The analyzer software then searches the FFT bins for symmetrical pairs of sidebands on either side of the 11.025kHz tone. 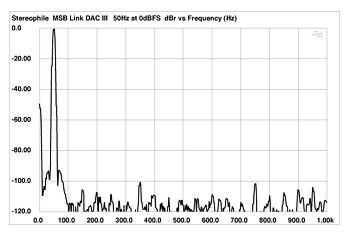 Fig.7 MSB Link III, spectrum of 50Hz sinewave, DC-1kHz, at 0dBFS into 100k ohms (linear frequency scale).
 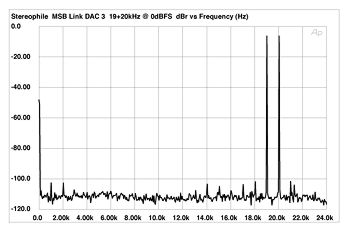 Fig.8 MSB Link III, HF intermodulation spectrum, DC-22kHz, 19+20kHz at 0dBFS into 100k ohms (linear frequency scale).
The result for the Link III is shown in fig.9. The grayed-out trace is with the unit set to decode 44.1kHz directly. An enormous boost in the noise floor can be seen on either side of the tone, and the measured jitter was 3030 picoseconds (ps). However, though this measurement was repeatable, I am not sure that it really shows what is happening. You can never eliminate the possibility that there is some strange interaction between the device under test and the test gear.
Fig.8 MSB Link III, HF intermodulation spectrum, DC-22kHz, 19+20kHz at 0dBFS into 100k ohms (linear frequency scale).
The result for the Link III is shown in fig.9. The grayed-out trace is with the unit set to decode 44.1kHz directly. An enormous boost in the noise floor can be seen on either side of the tone, and the measured jitter was 3030 picoseconds (ps). However, though this measurement was repeatable, I am not sure that it really shows what is happening. You can never eliminate the possibility that there is some strange interaction between the device under test and the test gear. 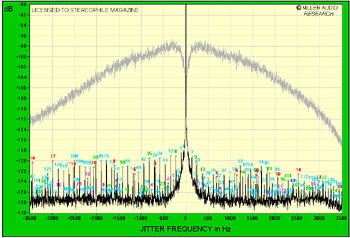 Fig.9 MSB Link III, 96kHz upsampling, high-resolution jitter spectrum of analog output signal (11.025kHz at -6dBFS with LSB toggled at 229Hz). Center frequency of trace, 11.025kHz; frequency range, ±3.5kHz. PS Lambda transport connected via 6' Apature S/PDIF cable. (Grayed-out trace is same conditions but without upsampling.) Switching in the 96kHz upsampling gave the black trace in fig.9. The absolute level of the jitter dropped to a respectable 165ps, which compares favorably with the 229ps I measured for the original Link DAC. There are some data-related sidebands present, indicated with red numeric markers, but perhaps the most significant aspect of this graph is the broadening of the central peak, due to low-frequency random jitter. Paul Miller has suggested in the past that this kind of measured behavior correlates with a broadened perceived soundstage, at the expense of a reduction in perceived "pace."—John Atkinson
Fig.7 MSB Link III, spectrum of 50Hz sinewave, DC-1kHz, at 0dBFS into 100k ohms (linear frequency scale). Fig.8 MSB Link III, HF intermodulation spectrum, DC-22kHz, 19+20kHz at 0dBFS into 100k ohms (linear frequency scale). Fig.9 MSB Link III, 96kHz upsampling, high-resolution jitter spectrum of analog output signal (11.025kHz at -6dBFS with LSB toggled at 229Hz). Center frequency of trace, 11.025kHz; frequency range, ±3.5kHz. PS Lambda transport connected via 6' Apature S/PDIF cable. (Grayed-out trace is same conditions but without upsampling.) Switching in the 96kHz upsampling gave the black trace in fig.9. The absolute level of the jitter dropped to a respectable 165ps, which compares favorably with the 229ps I measured for the original Link DAC. There are some data-related sidebands present, indicated with red numeric markers, but perhaps the most significant aspect of this graph is the broadening of the central peak, due to low-frequency random jitter. Paul Miller has suggested in the past that this kind of measured behavior correlates with a broadened perceived soundstage, at the expense of a reduction in perceived "pace."—John Atkinson