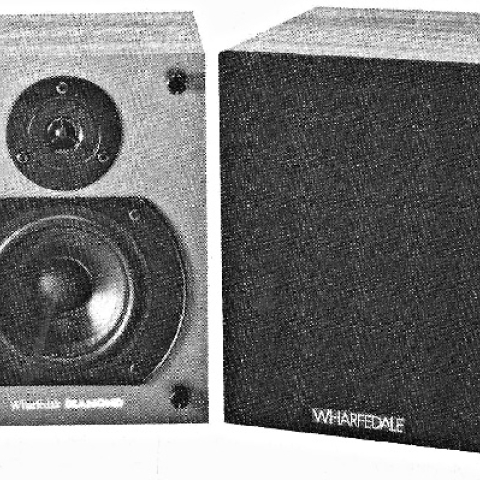
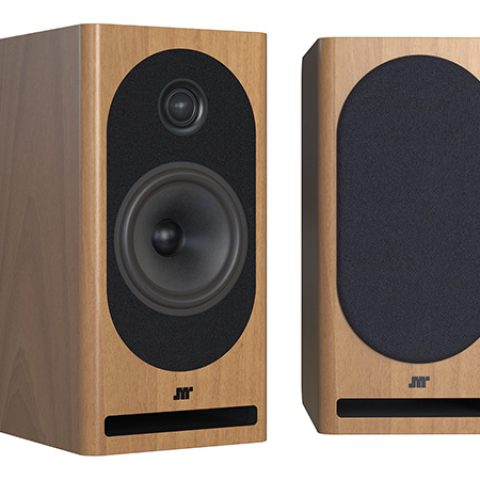
Sidebar 3: Measurements
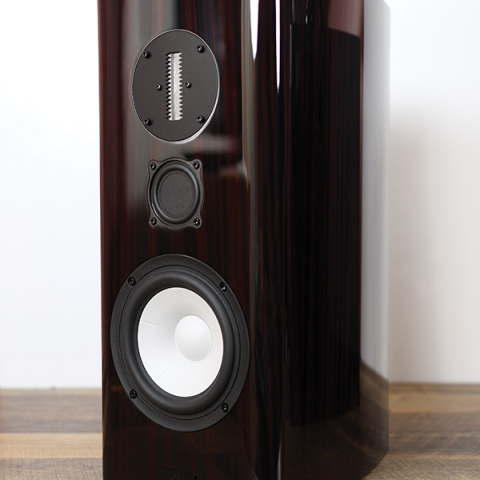
I used DRA Labs' MLSSA system with a calibrated DPA 4006 microphone to measure the MoFi SourcePoint 8's behavior in the farfield and an Earthworks QTC-40 mike for the nearfield responses. I left the grille off for the acoustic measurements.

Like the SourcePoint 10 I reviewed in February 2023, the MoFi SourcePoint 8 offers excellent measured performance.—John Atkinson
Footnote 1: EPDR is the resistive load that gives rise to the same peak dissipation in an amplifier's output devices as the loudspeaker. See "Audio Power Amplifiers for Loudspeaker Loads," JAES, Vol.42 No.9, September 1994, and stereophile.com/reference/707heavy/index.html.
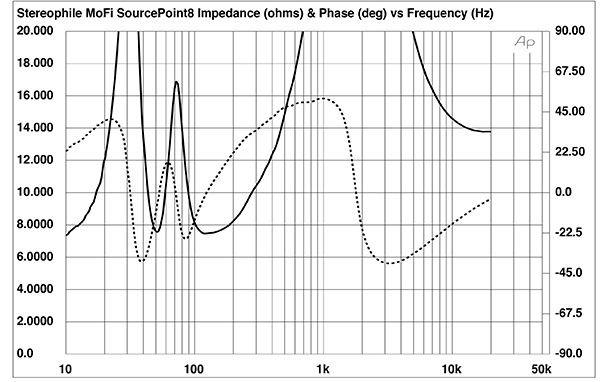
Fig.1 MoFi SourcePoint 8, electrical impedance (solid) and phase (dashed) (2 ohms/vertical div.).
The SourcePoint 8's specified sensitivity is 87dB/2.83V/m; my B-weighted estimate was the same. The SourcePoint 8's nominal impedance is specified as 8 ohms, with a minimum value of 6.4 ohms. I measured the speaker's impedance magnitude and phase with Dayton Audio's DATS V2 system, but for consistency with Stereophile's presentation of impedance graphs for the past 33 years, I created fig.1 with the Audio Precision System One software. The speaker's impedance magnitude (solid trace) is greater than 8 ohms for almost all the audioband, dropping to 7.47 ohms at 120Hz. If this speaker is used with tube amplifiers, the significantly higher impedance in the treble compared with that in the midrange will tilt up the high frequencies. With the high average impedance, the equivalent peak dissipation resistance, or EPDR (footnote 1), is generally greater than 4 ohms, though it does drop below that magnitude between 197Hz and 341Hz, with a minimum value of 3.83 ohms at 242Hz. Even so, the SourcePoint 8 is an easy load for an amplifier.
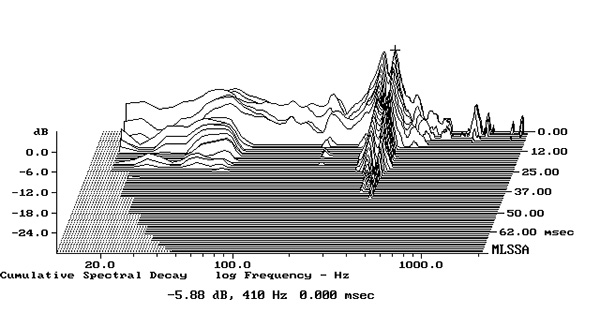
Fig.2 MoFi SourcePoint 8, cumulative spectral-decay plot calculated from output of accelerometer fastened to center of sidewall (measurement bandwidth, 2kHz).
The traces in fig.1 are free from the small discontinuities that would suggest the existence of panel resonances. However, when I investigated the vibrational behavior of the enclosure's side, top, and back panels with a plastic-tape accelerometer, I found a mode at 410Hz on the top and sides, another at 359Hz on the sides only (fig.2), and another at 355Hz on the back panel. These modes were all relatively low in level and had a high Q (Quality Factor), both of which will work against audibility.
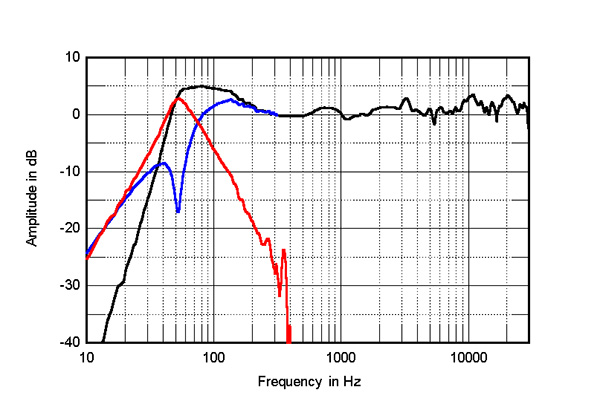
Fig.3 MoFi SourcePoint 8, anechoic response on tweeter axis at 50", averaged across 30° horizontal window and corrected for microphone response, with the nearfield woofer (blue) and port (red) responses and their complex sum (black), respectively plotted below 300Hz, 400Hz, and 300Hz.
The SourcePoint 8's impedance-magnitude plot has a saddle in the bass centered just above 50Hz, which will coincide with the tuning frequency of the two ports on the rear panel. The woofer's nearfield response (fig.3, blue trace) has the expected reflex notch at this frequency, and the summed output of the ports peaks between 30Hz and 100Hz (fig.3, red trace; both ports behaved identically). The ports' upper-frequency rolloff is clean. The complex sum of the woofer and port responses is shown as the black trace below 300Hz in fig.3. The boost in the upper bass is an artifact of the nearfield measurement technique, which assumes that the drive units are mounted in a baffle that extends to infinity in both vertical and horizontal directions. The SourcePoint 8's reflex alignment is maximally flat, in textbook fashion.
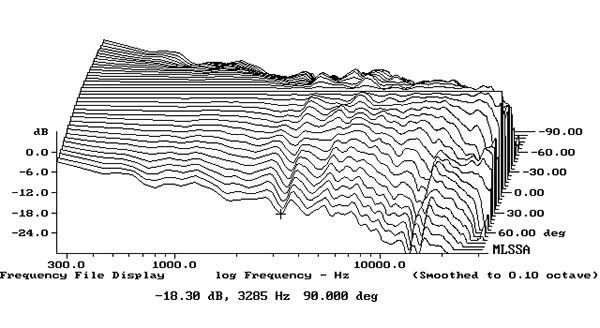
Fig.4 MoFi SourcePoint 8, lateral response family at 50", normalized to response on tweeter axis, from back to front: differences in response 90–5° off axis, reference response, differences in response 5–90° off axis.
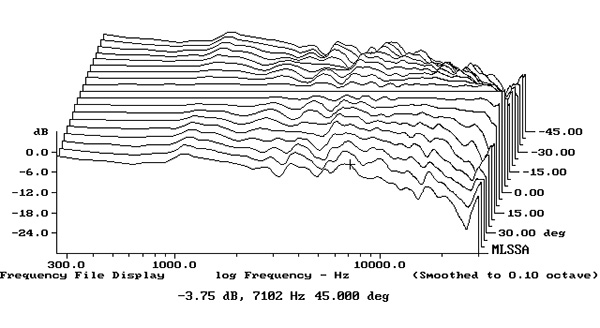
Fig.5 MoFi SourcePoint 8, vertical response family at 50", normalized to response on tweeter axis, from back to front: differences in response 45–5° above axis, reference response, differences in response 5–45° below axis.
The MoFi speaker's farfield output, averaged across a 30° horizontal window centered on the tweeter axis (fig.3, black trace above 300Hz), is even, though with a slight excess of energy in the upper midrange and above 9kHz. There is also a slight peak just above 3kHz in fig.3, but the cursor position in the speaker's horizontal dispersion graph (fig.4) suggests that this presence-region peak diminishes to the speaker's sides. Other than that, the SourcePoint 8's radiation pattern in both the horizontal (fig.4) and vertical (fig.5) planes is well-controlled, with the expected narrowing above 10kHz.
Fig.6 MoFi SourcePoint 8, step response on tweeter axis at 50" (5ms time window, 30kHz bandwidth).
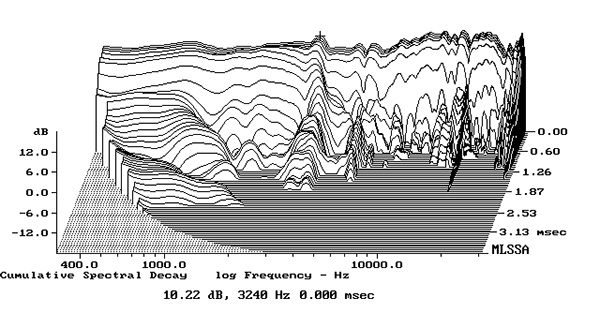
Fig.7 MoFi SourcePoint 8, cumulative spectral-decay plot on tweeter axis at 50" (0.15ms risetime).
Turning to the time domain, fig.6 shows the SourcePoint 8's step response on the tweeter axis. Both drivers are connected in positive acoustic polarity, with the tweeter's output arriving first at the microphone. The positive-going decay of the tweeter's step smoothly blends with the start of the woofer's step, which implies an optimal crossover implementation. Some ripples in the decay of the woofer's step might be associated with the ridge of delayed energy just above 3kHz in the MoFi speaker's cumulative spectral-decay (waterfall) plot (fig.7). (Ignore the apparent low-level ridge of delayed energy just below 16kHz, which is due to interference from the MLSSA host PC's video circuitry.)
Footnote 1: EPDR is the resistive load that gives rise to the same peak dissipation in an amplifier's output devices as the loudspeaker. See "Audio Power Amplifiers for Loudspeaker Loads," JAES, Vol.42 No.9, September 1994, and stereophile.com/reference/707heavy/index.html.