All this was clear from Eric Benjamin's aforementioned AES article, but the message seems not to have filtered through in the 13 years since (footnote 5). Loudspeaker impedance continues to be assessed by considering modulus and phase separately when, as Benjamin showed, there is a much better way to reflect the load's severity from the amplifier's viewpoint. What he did—as Douglas Self did later (footnote 6), though by the less elegant means of SPICE circuit simulation rather than mathematical analysis—was to plot peak output-stage power dissipation vs frequency with respect to a stated resistive load. Benjamin chose 4 ohms as his reference, while Self preferred 8 ohms. Such curves can be calculated analytically from conventional modulus and phase data—no additional measurements are necessary.
Using this same technique to assess three loudspeakers I've recently measured for UK magazine Hi-Fi News gives the results shown in figs. 5–7. Note that each of these graphs has a different vertical scale. In each case, 1 on the vertical axis represents the output-device power dissipation for an 8 ohm resistive load, assuming a perfect class-B amplifier—that is, one able to deliver its full rail voltage to the load. Although no class-B amplifier is actually able to do this, some come close, and making this assumption allows for a worst-case calculation.
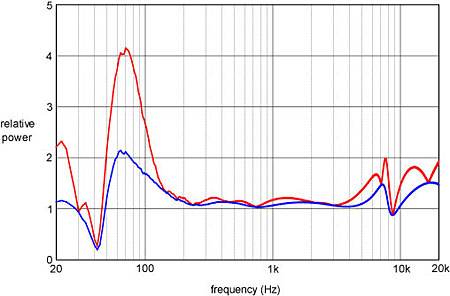 Fig.5 Device dissipation (peak, red trace; average, blue trace) relative to an 8 ohm resistive load for the JBL 1400 Array.
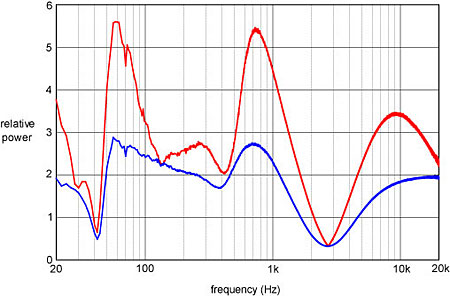 Fig.6 As fig.5, but for the B&W 802D.
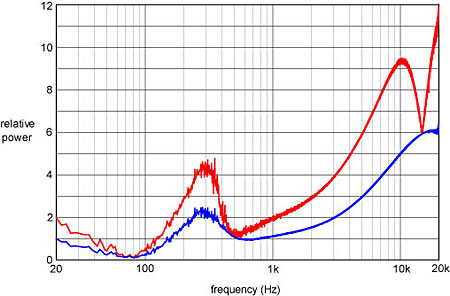 Fig.7 As fig.5, but for the Final 600i.
Fig.5 is for the JBL 1400 Array, fig.6 for the B&W 802D, and fig.7 for the Final 600i electrostatic—a dipole speaker of scarily low impedance at high frequencies. In each case, the red trace represents the peak instantaneous device dissipation, while the blue trace represents the average dissipation. It is the former, peak result that we are most interested in here as a measure of load severity; average device dissipation relates to heatsink provision and so is of interest primarily to the amplifier designer (although, since we consumers pay dearly for heatsink capability, it is not something for us to ignore).
Although both Benjamin and Self chose this means to display the device dissipation imposed by a loudspeaker, it suffers two problems. First, the scaling of the vertical axis depends on the chosen reference resistance; second, we are used to identifying the minima in modulus vs impedance graphs as potential problem areas, whereas here it is the maxima which are of concern. Both difficulties can be solved by plotting what I term equivalent peak dissipation resistance (EPDR) vs frequency, which inverts the graph and removes any need of a reference. EPDR is simply the resistive load that would give rise to the same peak device dissipation as the speaker itself. Adopting the EPDR view, the red traces of figs.5–7 become those of figs.8–10.
Fig.7 As fig.5, but for the Final 600i.
Fig.5 is for the JBL 1400 Array, fig.6 for the B&W 802D, and fig.7 for the Final 600i electrostatic—a dipole speaker of scarily low impedance at high frequencies. In each case, the red trace represents the peak instantaneous device dissipation, while the blue trace represents the average dissipation. It is the former, peak result that we are most interested in here as a measure of load severity; average device dissipation relates to heatsink provision and so is of interest primarily to the amplifier designer (although, since we consumers pay dearly for heatsink capability, it is not something for us to ignore).
Although both Benjamin and Self chose this means to display the device dissipation imposed by a loudspeaker, it suffers two problems. First, the scaling of the vertical axis depends on the chosen reference resistance; second, we are used to identifying the minima in modulus vs impedance graphs as potential problem areas, whereas here it is the maxima which are of concern. Both difficulties can be solved by plotting what I term equivalent peak dissipation resistance (EPDR) vs frequency, which inverts the graph and removes any need of a reference. EPDR is simply the resistive load that would give rise to the same peak device dissipation as the speaker itself. Adopting the EPDR view, the red traces of figs.5–7 become those of figs.8–10.
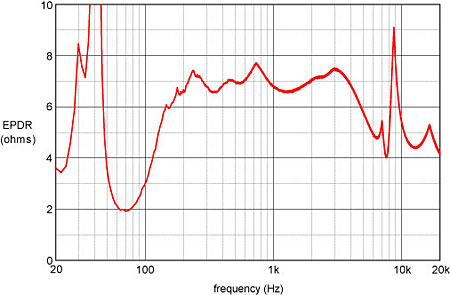 Fig.8 Equivalent peak dissipation resistance (EPDR) of the JBL 1400 Array.
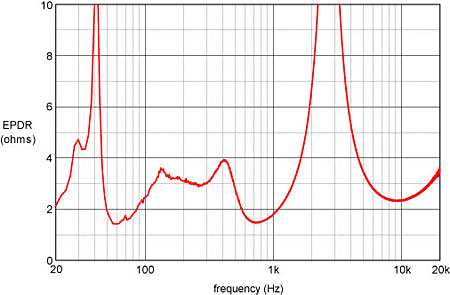 Fig.9 EPDR of the B&W 802D.
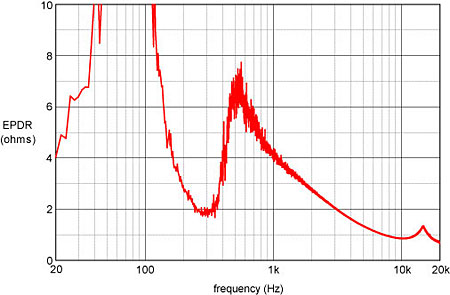 Fig.10 EPDR of the Final 600i.
The first thing to note from these is that all three speakers have EPDRs that dip below 2 ohms. In the case of the Final, the minimum is well below 1 ohm, albeit at very high frequency (and clearly continues to decrease above the measurement limit of 20kHz, suggesting that this is not a loudspeaker to use in a system whose CD player does not have effective image filtering). Moreover, these minima are significantly lower than indicated by each speaker's minimum modulus, and they occur at different frequencies. In fact, in dynamic speakers the minimum EPDR generally occurs quite close to peaks in the modulus curve that relate to driver fundamental resonances. The modulus here is still well above minimum but the phase angle is large, hence the low EPDR. (Self believed he was the first to show this effect, but in fact it was clear from Benjamin's work.)
Let's look at specifics, beginning with the JBL 1400 Array. Its minimum modulus of 4.9 ohms occurs at 92Hz. Its minimum EPDR is 1.9 ohms and occurs at 70Hz, where the impedance modulus is 6.1 ohms—almost 25% above minimum—but the phase angle is a high –52°. The B&W 802D, by contrast, has two pronounced EPDR minima: the first of 1.4 ohms at 58Hz, and the second of 1.5 ohms at 722Hz. Its minimum modulus of 3.2 ohms is over twice the EPDR minima and occurs at 86Hz. Because it is an electrostatic dipole, the Final 600i behaves quite differently. Its EPDR minimum of around 0.7 ohm occurs at the measurement frequency limit of 20kHz and is due to the speaker presenting a severe capacitive load at high frequencies. Again, the impedance modulus minimum of 1.3 ohms is roughly twice the minimum EPDR and occurs at a different frequency (15.4kHz).
Fig.10 EPDR of the Final 600i.
The first thing to note from these is that all three speakers have EPDRs that dip below 2 ohms. In the case of the Final, the minimum is well below 1 ohm, albeit at very high frequency (and clearly continues to decrease above the measurement limit of 20kHz, suggesting that this is not a loudspeaker to use in a system whose CD player does not have effective image filtering). Moreover, these minima are significantly lower than indicated by each speaker's minimum modulus, and they occur at different frequencies. In fact, in dynamic speakers the minimum EPDR generally occurs quite close to peaks in the modulus curve that relate to driver fundamental resonances. The modulus here is still well above minimum but the phase angle is large, hence the low EPDR. (Self believed he was the first to show this effect, but in fact it was clear from Benjamin's work.)
Let's look at specifics, beginning with the JBL 1400 Array. Its minimum modulus of 4.9 ohms occurs at 92Hz. Its minimum EPDR is 1.9 ohms and occurs at 70Hz, where the impedance modulus is 6.1 ohms—almost 25% above minimum—but the phase angle is a high –52°. The B&W 802D, by contrast, has two pronounced EPDR minima: the first of 1.4 ohms at 58Hz, and the second of 1.5 ohms at 722Hz. Its minimum modulus of 3.2 ohms is over twice the EPDR minima and occurs at 86Hz. Because it is an electrostatic dipole, the Final 600i behaves quite differently. Its EPDR minimum of around 0.7 ohm occurs at the measurement frequency limit of 20kHz and is due to the speaker presenting a severe capacitive load at high frequencies. Again, the impedance modulus minimum of 1.3 ohms is roughly twice the minimum EPDR and occurs at a different frequency (15.4kHz).
Footnote 5 It has been on my "To Do" list since I first read the Benjamin paper to calculate a Figure of Merit, such as Keith's EPDR, for the speakers reviewed in Stereophile, based on their measured impedance modulus and electrical phase angle. But like all things that may be important but are not urgent, this project has so-far remained unrealized.—John Atkinson Footnote 6 D. Self, "Speaker Impedance Matters," Electronics World, November 1997.
Fig.5 Device dissipation (peak, red trace; average, blue trace) relative to an 8 ohm resistive load for the JBL 1400 Array.
Fig.6 As fig.5, but for the B&W 802D.
Fig.7 As fig.5, but for the Final 600i.
Fig.5 is for the JBL 1400 Array, fig.6 for the B&W 802D, and fig.7 for the Final 600i electrostatic—a dipole speaker of scarily low impedance at high frequencies. In each case, the red trace represents the peak instantaneous device dissipation, while the blue trace represents the average dissipation. It is the former, peak result that we are most interested in here as a measure of load severity; average device dissipation relates to heatsink provision and so is of interest primarily to the amplifier designer (although, since we consumers pay dearly for heatsink capability, it is not something for us to ignore).
Although both Benjamin and Self chose this means to display the device dissipation imposed by a loudspeaker, it suffers two problems. First, the scaling of the vertical axis depends on the chosen reference resistance; second, we are used to identifying the minima in modulus vs impedance graphs as potential problem areas, whereas here it is the maxima which are of concern. Both difficulties can be solved by plotting what I term equivalent peak dissipation resistance (EPDR) vs frequency, which inverts the graph and removes any need of a reference. EPDR is simply the resistive load that would give rise to the same peak device dissipation as the speaker itself. Adopting the EPDR view, the red traces of figs.5–7 become those of figs.8–10.
Fig.8 Equivalent peak dissipation resistance (EPDR) of the JBL 1400 Array.
Fig.9 EPDR of the B&W 802D.
Fig.10 EPDR of the Final 600i.
The first thing to note from these is that all three speakers have EPDRs that dip below 2 ohms. In the case of the Final, the minimum is well below 1 ohm, albeit at very high frequency (and clearly continues to decrease above the measurement limit of 20kHz, suggesting that this is not a loudspeaker to use in a system whose CD player does not have effective image filtering). Moreover, these minima are significantly lower than indicated by each speaker's minimum modulus, and they occur at different frequencies. In fact, in dynamic speakers the minimum EPDR generally occurs quite close to peaks in the modulus curve that relate to driver fundamental resonances. The modulus here is still well above minimum but the phase angle is large, hence the low EPDR. (Self believed he was the first to show this effect, but in fact it was clear from Benjamin's work.)
Footnote 5 It has been on my "To Do" list since I first read the Benjamin paper to calculate a Figure of Merit, such as Keith's EPDR, for the speakers reviewed in Stereophile, based on their measured impedance modulus and electrical phase angle. But like all things that may be important but are not urgent, this project has so-far remained unrealized.—John Atkinson Footnote 6 D. Self, "Speaker Impedance Matters," Electronics World, November 1997.


