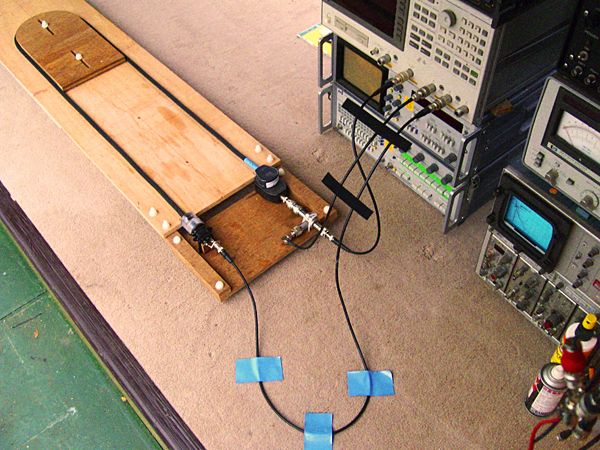
Testing the RF transmission of Kimber Kable, up to 3GHz, at Ben Duncan Research Labs, in 2008. The resulting proof of RF rejection was published on-line by Russ Andrews Accessories in England. (Photo: Naomi Swain).
Editor's Preface: In an article in the October 1995 issue of Stereophile, Professor Malcolm Omar Hawksford used Maxwell's Equations to develop a mathematical model describing the behavior of cables at audio frequencies. Among the predictions of this model were that for good conductors there exists an optimum size of wire for audio signal transmission, and that for a wire larger than this size an energy storage mechanism would exist. In his article Malcolm described a simple experiment, the results of which appeared to confirm his hypothesis.
Then serendipity struck. English engineer Ben Duncan, whose writings have occasionally appeared in Stereophile, sent me an article he had written for the pro-audio magazine Studio Sound. The results of a series of cable measurements he had performed seemed to confirm the Hawksford Hypothesis. We offer them here for your delight and delectation.—John Atkinson
Even if you've only glanced at the contents of hi-fi magazines in the past decade and a half, it's likely you've seen reviews of exotic cables. The permutations of conductor and insulator qualities, constructions, and aesthetics are immense. So are some of the prices—with exotic speaker cables ranging up to $100/m, or even more! Cable purchase would be less worrying if there were evidence of progressive, price-linked merit. Instead, in any system having sufficient resolution, almost any cable change affects some aspect of sonic quality. There appears to be an almost random relationship between audio cable construction and sound quality, and few—if any—coherent, solid technical justifications exist for the different design approaches. And sometimes, long-term listening tests have ranked a low-priced speaker cable as being almost as good as a very expensive type (footnote 1). Many manufacturers, particularly in the US, hide their apparent ignorance about what they're making behind impressive-sounding but almost meaningless phrases like "time-compensated" (try delay-compensated), "phase noise," and "phase coherence") (footnote 2). Many makers evidently just copy. No doubt their products can sound better in particular ways and in particular instances, but the real innovators are few; those who really have a handle on what they're doing are even fewer.
About 20 years ago, a few perceptive listeners noticed differences in the depth of bass, or resolution of vocal detail, when different cables were substituted for the zipcord and 0.75mm2 PVC- or rubber-insulated mains cables—the norm for speaker wiring in homes and recording studios, respectively. This discovery that "cable does matter" led to the use of much thicker wire as an aid to loudspeaker damping or the use of Litz-wired cable. The combination of reduced inductance and increased capacitance of some of these cables, particularly with the latter, was enough to make marginally stable, badly designed, and generally flaky amplifiers "go RF" and expire. The ensuing panic and apparent total non-communication between cable experimenters and amplifier designers explains the raison d'être of low-capacitance, "spaced-eight" (ie, O–O) speaker cables. Over the past decade, ideas have changed regarding how loudspeaker cables should be best designed in order to accurately transfer audio signals. In a 1991 AES paper on cable (footnote 4), down-to-earth US audio consultant Fred Davis attacked cable makers' hypotheses that factors of undeniable importance at radio frequencies (notably, the characteristic impedance) were of relevance at audio frequencies given the length of any practical speaker cable runs.
The tests on which I based this article arose from a challenge to validate Jenving's claims. I had already used the MicroCAP IV (PC-based) simulation of loudspeaker/amplifier interfaces to demonstrate the existence of energy "tails" when a stimulus stopped. Taking this into "realspace," the Dual Domain DSP version of the Audio Precision System One test set allows audio signals to be graphed over time. It's analogous to using a storage oscilloscope, or performing transient analysis with a circuit simulator. The test setup is shown in fig.1. The Audio Precision's sample rate was set to 192kHz, with a free-running trigger. Each of the Cables Under Test (CUT)—see the "Test Group" sidebar—was 5.5m (18') long. Note that the signal was read at both ends of the CUT and both waveforms are shown in each of the graphs. This poses a question: What cable to use for these sensing connections? They each needed to be about 1.9m long, and their own reactance—hence energy storage characteristics—would be expected to affect the results. On the other hand, as sensing cables, they're not passing any appreciable current. This explains why the "obvious" course of using the CUT for sensing, too, wasn't adopted—according to Jenving and others, the optimum cable characteristic for the sensing or line-level condition is the opposite of the CUT's characteristics or condition.
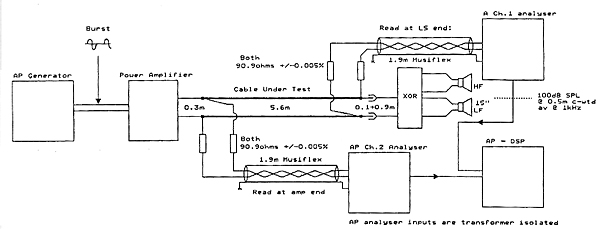
Fig.1 The test setup uses standard DSP-aided test equipment from Audio Precision.
Fig.1 shows how the sensing cabling was partly isolated with standoff resistors. Their value was governed by the need to: a) maintain a reasonably low source impedance in the sense of cabling, b) not unduly increase the AP analyzer's noisefloor, and c) not unduly degrade the analyzer's Common-Mode Rejection (CMR). To keep CMR better than –80dB, 10-year-aged (read: stable) Holco metal-film resistors were matched in each pair to better than ±0.006% at the room temperature, with a Datron 6.5-digit digital meter. For all tests, the sense cables were identical (within ±2%) lengths of identically colored Musiflex cabling taken off the same reel (footnote 5).
Optimum cable placement in a crowded lab required some lateral thinking. First, the CUT needed to have both ends relatively near one another so that the sense cables could be the same length without coiling or folding. But the tested cable couldn't be tied back on itself, as this would cancel some inductance, and wouldn't represent a real condition of use. Second, a quick method was needed to make the positioning easy to replicate, without sticking everything down with gaffer tape. Third, the CUT had to be kept away from other parallel cables, EMI sources (any one of three PCs and VDUs), and any substantial areas of ferromagnetic material (such as steel test-equipment casings) to avoid warping the CUTs' immediate electromagnetic environment. Repeat positioning would then be less critical.
The solution was to hang the cable from a wooden roof beam. The cable's N-shaped length (2.2m up, 1.1m across, 2.2m down) was then well separated from bad influences, and was mainly orthogonal to them.
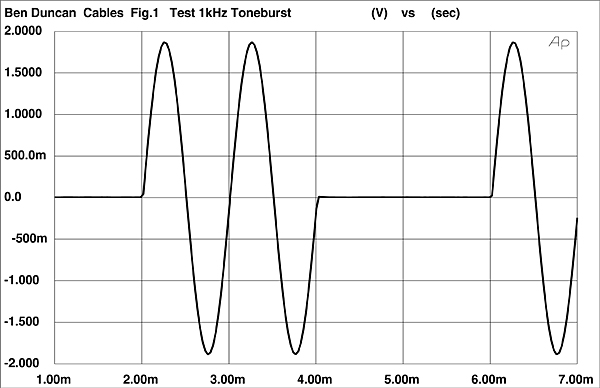
Fig.2 The test toneburst.
Comprehending the picturesFor anyone who has doubted that loudspeaker cables can affect music reproduction, and equally for those who can readily perceive differences but have given up hope of measuring them, here at last are some easy-to-grasp pictures of what's going on. Fig.3 shows a typical measurement plotted to the same scale as fig.2. A very slight difference can be seen after the stop of the toneburst, but the scale here is too coarse to be meaningful. Each of the following graphs therefore shows a magnification of the voltage at the point immediately after the sinewave burst stops (by about 25 times). A resumption of a straight, central, horizontal line would be ideal. But cables, passive crossovers, and speakers (in ascending order) are all energy-storage devices. The most immediate analogy is room reverberant decay. In theory, the stored energy should be clamped right down on and done away with quickly, by virtue of the high negative feedback (NFB) still used in most power amplifiers.
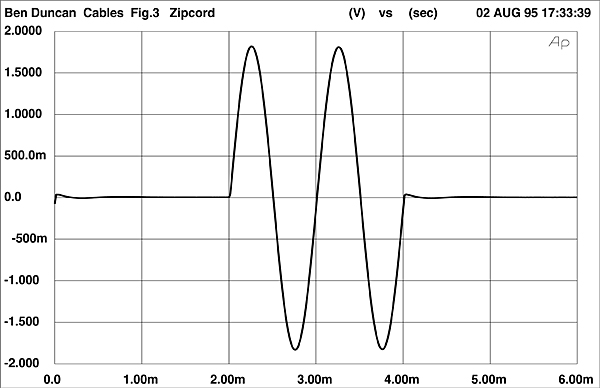
Fig.3 Zipcord at 1kHz.
Footnote 1: Dick Olsher, "Cable Bound" (review of speaker cables), Stereophile, Vol.11 No.7, July 1988 (pp.103–118). See also manufacturer and reader responses, July and October 1988, and March 1989.


