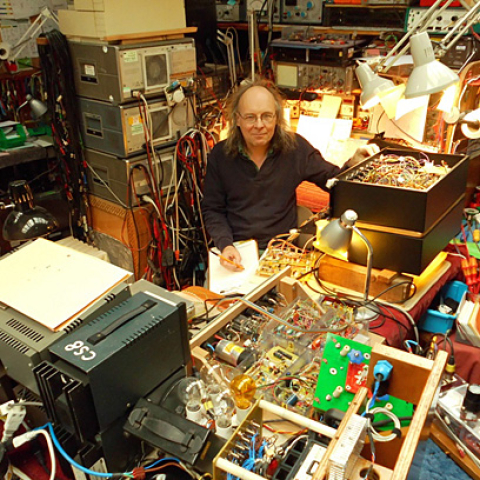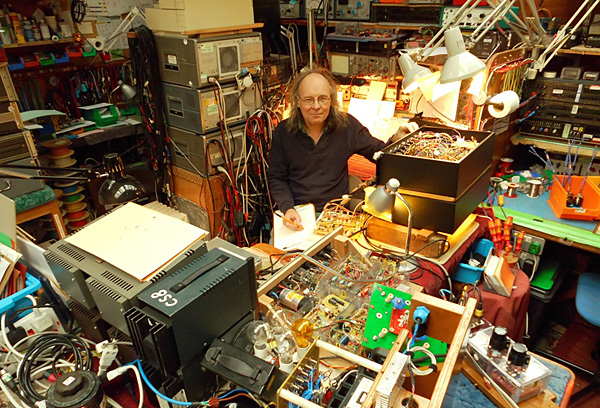
Ben Duncan at work in his No.1 lab. (Photo: Jasmine Grierson)
Power amplifiers fascinate me. In the past 15 years I've helped design and build over a dozen advanced models, with output powers ranging from 50 to 2500W, for a number of the UK's professional equipment manufacturers. To learn from others' ideas and mistakes, I've also repaired, measured, used, and reviewed hundreds of makes of amplifier. My experiences have led me to regard the power amplifier as one of the messiest, most imperfect pieces of electronic equipment in the record/replay path.
The Setting ApartWhy should this be so? Creating good-sounding mixing consoles, preamplifiers, volume controls, D/A converters, and crossovers is difficult enough (!). Still, there are few really ugly engineering problems; the attainment of good objective performance (a good baseline) should be relatively straightforward, leaving the designer to concentrate 70% of his mental budget on sonics, system overview, producibility, reliability, cost, and the like. Compared to a properly engineered power stage, a line-level audio stage is relatively simple, with even the worst-case load conditions defined. Power amplifiers, on the other hand, are hooked up to complex, ill-defined loads while being asked to deliver a thousand times as much current as any other audio circuit. This is a key factor, as both electromagnetic interference and impedance-related interactions between supposedly separate conductors and circuits are proportional to the currents involved, while heating and consequent thermal interactions are proportional to the square of that current.
Over the past decade, it has been established in DIY audiophile circles that upgrading component parts in any reasonable amplifier design can change and generally improve sonics, often greatly—even though the circuitry itself remains unchanged. As nothing has been forthcoming from the scientific and academic community as to why this should be, I undertook an experiment of my own. I would investigate the influence of passive components on the measured performance of a typical amplifier. My experimental field was Audio Precision's System One Dual Domain DSP test set, the "Senior Model." Since this device's introduction in the fall of 1988, a growing body of users has been able to routinely measure the levels of individual distortion harmonics, even with modern semiconductor electronics where the harmonics are generally below 0.1% and substantially buried beneath the noise floor.
Fig.1 shows the manner in which the percentage of Total Harmonic Distortion plus Noise (THD+N, footnote 6) in the amplifier's output varies with frequency, before and after modification (dashed and solid traces, respectively). The amplifier was driving an 8 ohm resistive load, about 0.6dB below its clipping point. Before modification, the curves for the two channels were nearly identical, close enough to be interlaced. It can be seen from fig.1, however, that the modified channel's THD+N curve is higher overall than the unmodified unit's. This need not mean that increased distortion per se is the sole reason for the difference. In fact, the fact that the replacement op-amp is 12–15dB noisier is bound to have an effect on this measurement. The only hint of the sonic improvement offered by the upgrade is a slight change in curvature at the edges of the modified unit's plot (top, dashed curve). Here, the rate of increase of THD (and/or noise) with frequency looks like it will level off and perhaps fall at ultrasonic frequencies, whereas the unmodified unit's THD+N (bottom, solid curve) looks like it will skyrocket above 30kHz.
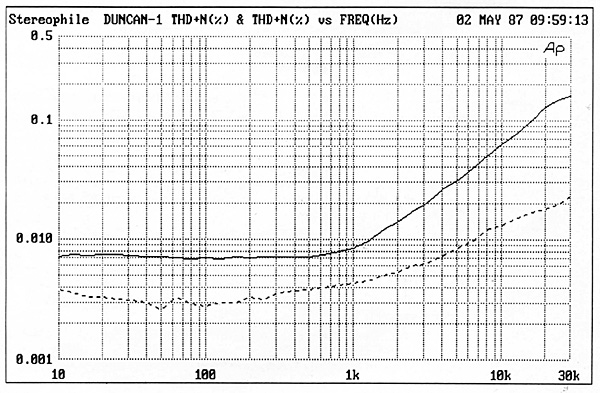
Fig.1 Amplifier THD+Noise vs frequency before (dashed line) and after (solid line) modification (8 ohm load, 0.6dB below clipping). The increase is not wholly due to THD, as the sonically superior op-amp has higher noise.
Fig.2 uses the Audio Precision's DSP facility to plot the second to seventh harmonics of the unmodified channel, again driven into 8 ohms, at a fractionally lower level of 2dB below the amplifier's clipping point. In general, the spectra could be termed chaotic, noise residue making the plots below the 0.001% point erratic. But the general picture is quite clear: the second harmonic dominates, followed by the third, below 3kHz—excepting a sporadic dip and change in order between 600 and 700Hz. Above 3kHz, the fourth and fifth harmonics dominate, giving way above 18kHz to the third (footnote 7). Above 7kHz, analysis is complex, as the seventh harmonic is then the next most dominant, but the seventh harmonics of frequencies above 7kHz lie above 49kHz. The effect of these products will not be directly audible, but they can create unpleasant intermodulation products in the audible band.
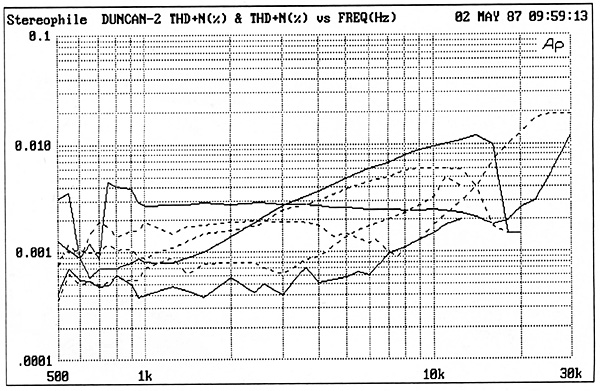
Fig.2 Harmonics of the unmodified amplifier's distortion spectrum plotted against frequency (8 ohm load, 2dB below clipping). Solid lines, from top to bottom at 10kHz: 4th harmonic, 2nd harmonic, 6th harmonic. Dashed lines, from top to bottom at 10kHz: 5th harmonic, 7th harmonic, 3rd harmonic.
By comparison with fig.2, fig.3 shows that the modified amplifier's harmonic structure has become much cleaner, even taking into account the fact that harmonic levels are higher and thus lifted away from the noise-floor. Now the subjectively innocuous second harmonic can be seen to dominate clearly at all frequencies. The even fourth and sixth harmonics are clearly the next most dominant, respectively. Overall, the even-order (second/fourth/sixth) harmonics dominate the structure; moreover, they are in their natural sequence, the lowest orders being the stronger. The odd harmonics aren't so naturally ordered; eg, the third is weaker than the fifth and seventh below 8kHz.
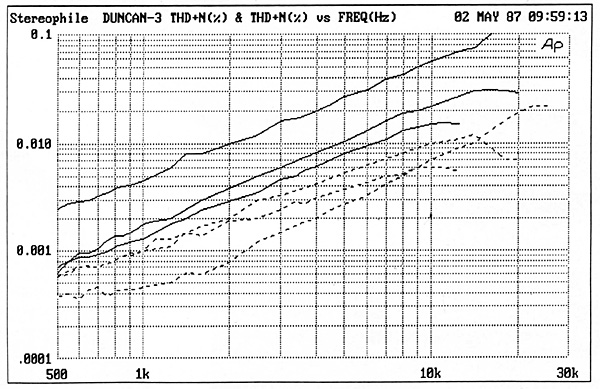
Fig.3 Harmonics of the modified amplifier's distortion spectrum plotted against frequency (8 ohm load, 2dB below clipping). Solid lines, from top to bottom at 10kHz: 2nd harmonic, 4th harmonic, 6th harmonic. Dashed lines, from top to bottom at 10kHz: 5th harmonic, 3rd harmonic, 7th harmonic. Harmonic order is more monotonic, indicating a more consistent sonic character.
Recall the late '70s, when Japanese manufacturers' glossy advertisements promised amplifiers with THD+N levels of 0.0002% or lower? In practical production, and at power levels ranging into hundreds of watts into 4 ohms and below, you can usually attain figures of this magnitude only with carefully trimmed high or multiple feedback circuitry, and then usually only at 1kHz and below.
Footnote 1: This was pointed out by Stereophile's founder, J. Gordon Holt, some 25 years ago. In addition, Stereophile's Test CD 2 has a number of tracks comparing the audibility of large and small amounts of different harmonics: the second, third, and seventh. I prepared the signals for these tracks entirely in the digital domain using the Audio Precision System One Dual Domain.—John Atkinson Footnote 2: Russell O. Hamm, "Tubes vs Transistors—Is There an Audible Difference?," JAES, May 1973. Footnote 3: Mark Burgin & Ben Duncan, "Dynamic Loudness Compensation," Proc. IOA, Vol.8, 1987. See also Louis Fielder, "Human Auditory Capabilities and Their Consequences in Digital-Audio Converter Design," AES 7th International Conference, Toronto, May 1989, Paper 4A, in which Mr. Fielder shows that the order of a distortion harmonic is as important if not more so than its absolute level when it comes to audibility. Footnote 4: J.R. Stuart, "Psychoacoustic Models for Evaluating Errors in Audio Systems," Proc. IOA, Vol.13 Pt.7 (1991). See also "Estimating the Significance of Errors in Audio Systems" and "Predicting the Audibility, Detectability and Loudness of Errors in Audio Systems," two papers presented by Bob Stuart at the 91st Convention of the Audio Engineering Society, held in New York in October 1991.