
Author's Note: Although I started accompanying Stereophile's loudspeaker reviews with measurements soon after I joined the magazine in 1986, it wasn't until 1989, when we acquired an Audio Precision System One electronics analyzer and the then-new MLSSA speaker measurement system from DRA Labs, that I developed the standardized data presentation that is still featured in our reviews more than three decades later. In this article from October 1991, I summarize the results from the first two years of using MLSSA to test 69 loudspeakers.—John Atkinson
It was the Saturday of Stereophile's 1991 Writers' Conference. The gathered scribes were talking about the circular logic of how you can't assess the worth of a component except by listening to recordings through it—except that you first have to listen to those recordings through the component to find out how good they were. "The entire recording process is a bent tool," said Corey Greenberg, and unless you know exactly how "bent" any recording is, how can it be used to assess the effect of a loudspeaker, say?
As any engineer will tell you, the "objective" world of measurement is not necessarily any better: you can neither be entirely sure that your test instruments are not themselves changing the performance of the component you are measuring, nor that they are not behaving as bent tools, particularly in the hands of the less-experienced operator. "Given half a chance, your test instruments will lie to you!" was the first piece of advice my electronics lecturer gave me when I started university (footnote 1). (I find it interesting that many of those "objectivists" who are most dogmatic about their faith in "science" do not themselves have any scientific education or background. One relatively high-profile "objectivist" loudspeaker reviewer, for example, seems to pride himself on his lack of any formal technical education (footnote 2).
 Nearly 70 speaker models in two years, all measured in a consistent manner (with few exceptions, the curves shown are the responses of the speakers averaged across a 30° window on the listening axis)—that's a heck of a lot. More, in fact, than published in any other US audio magazine during the same period (footnote 5). I started thinking about how to present all these curves so that some useful relationships between them could be thrown up, therefore.
Ultimately, I decided to present them in descending order of "flatness." Then, however, there remained the problem of how to assess "flatness." To do it visually would probably be good enough—the human eye is excellent at picking out patterns—but I would need something a little more—how can I best express it?—"objective," so that designers and manufacturers wouldn't be able to complain that I had been too arbitrary in my assessment of their babies' performance.
What I did, therefore, was to calculate the standard deviation of each speaker's response data over the two decades from the bottom of the lower midrange, 170Hz, to the approximate high-frequency limit of human hearing, 17kHz. (The standard deviation is a statistical measure, being the root-mean-square of the deviations of the data points from their average value.) This way, the effect of the ubiquitous but inaudible resonant peak of metal-dome tweeters would be dismissed, as would the unpredictable behavior of loudspeakers in their upper-bass regions.
One complication remained, however, which was that like any FFT-based measuring system, MLSSA produces response data files that have a fundamentally linear frequency scale; ie, the data points are spaced apart by an equal number of Hertz. Human hearing, however, is logarithmic when it comes to perception of frequency: though there are 10 times as many frequencies between 10kHz and 20kHz as there are between 1kHz and 2kHz and 10 times as many frequencies between 1kHz and 2kHz as there are between 100Hz and 200Hz, the subjective difference is the same with all three pairs of frequencies, the pitch difference being in each case one octave. If I just used the standard deviation of the data, departures from flat response above 10kHz (a region where human hearing is relatively insensitive) would dominate the result, leading to a ranking that wouldn't correlate very well with reality. Accordingly, therefore, I rewrote my statistics program to apply a simple scaling factor to compensate for this fact.
Nearly 70 speaker models in two years, all measured in a consistent manner (with few exceptions, the curves shown are the responses of the speakers averaged across a 30° window on the listening axis)—that's a heck of a lot. More, in fact, than published in any other US audio magazine during the same period (footnote 5). I started thinking about how to present all these curves so that some useful relationships between them could be thrown up, therefore.
Ultimately, I decided to present them in descending order of "flatness." Then, however, there remained the problem of how to assess "flatness." To do it visually would probably be good enough—the human eye is excellent at picking out patterns—but I would need something a little more—how can I best express it?—"objective," so that designers and manufacturers wouldn't be able to complain that I had been too arbitrary in my assessment of their babies' performance.
What I did, therefore, was to calculate the standard deviation of each speaker's response data over the two decades from the bottom of the lower midrange, 170Hz, to the approximate high-frequency limit of human hearing, 17kHz. (The standard deviation is a statistical measure, being the root-mean-square of the deviations of the data points from their average value.) This way, the effect of the ubiquitous but inaudible resonant peak of metal-dome tweeters would be dismissed, as would the unpredictable behavior of loudspeakers in their upper-bass regions.
One complication remained, however, which was that like any FFT-based measuring system, MLSSA produces response data files that have a fundamentally linear frequency scale; ie, the data points are spaced apart by an equal number of Hertz. Human hearing, however, is logarithmic when it comes to perception of frequency: though there are 10 times as many frequencies between 10kHz and 20kHz as there are between 1kHz and 2kHz and 10 times as many frequencies between 1kHz and 2kHz as there are between 100Hz and 200Hz, the subjective difference is the same with all three pairs of frequencies, the pitch difference being in each case one octave. If I just used the standard deviation of the data, departures from flat response above 10kHz (a region where human hearing is relatively insensitive) would dominate the result, leading to a ranking that wouldn't correlate very well with reality. Accordingly, therefore, I rewrote my statistics program to apply a simple scaling factor to compensate for this fact.
Footnote 1: His second piece of advice was that a soldered joint couldn't be assumed to be sound unless it held together when you swung it around your head by the lead, something that holds just as true now as it did then. Footnote 2: "I have no academic training in physics, electronics, or acoustics." David Moran in Speaker Builder, Four/91, p.52.
Footnote 3: Although I still use this calibrated B&K microphone in 2020, I also use calibrated microphones from Earthworks, Mitey Mike, Studio Six Digital, and Dayton Audio.
Footnote 4: Though I'm only responsible for writing a fraction of the loudspeaker reviews that appear in Stereophile, I do perform all the measurements that accompany those reviews.
Footnote 5: As of February 2020, when this article was republished on this website, I have measured 931 loudspeakers with DRA Labs MLSSA and my B&K 4006 microphone, mostly for Stereophile but also for its now defunct sister magazine Stereophile Guide to Home Theater from 1994 to 2000.
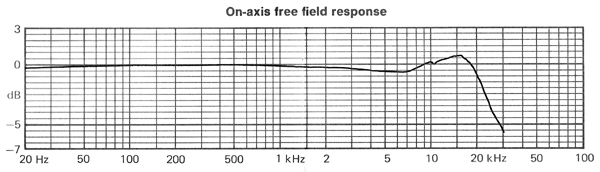
Fig.1, On-axis, free-field calibration curve supplied with B&K 4006 microphone, serial number 1039772 (0.5dB/vertical div.)
When I decided to incorporate measurements into Stereophile's loudspeaker reviews, I purchased a high-quality microphone that I was sure was relatively flat in its on-axis response, a B&K 4006. Though this omnidirectional microphone with a ½"-diameter capsule is mainly intended for recording work, I chose it because it could give dual service: I wanted to use it both for measuring and for making recordings for the magazine. Fig.1 shows the calibration response supplied with the microphone: a slight lack of energy can be seen in the lower treble, as well as a slight peak in the top audio octave. The maximum departure from a flat response is only about 0.75dB in either direction below 20kHz—each small division in fig.1 is 0.5dB—so I felt confident in being able to use this mike for my measurements with the DRA Labs MLSSA system (footnote 3).
However, it quickly became obvious that the mike's response was not as flat as claimed; though we had no way of knowing exactly what it was, the top-octave rise was audibly somewhat higher than shown in fig.1. (Its sound can be heard on track 5 of the Stereophile Test CD, index 7.) Though we've been careful to make allowance for this discrepancy in our analyses of loudspeaker measurements, it has been present in all of Stereophile's loudspeaker curves that were published before October 1991.
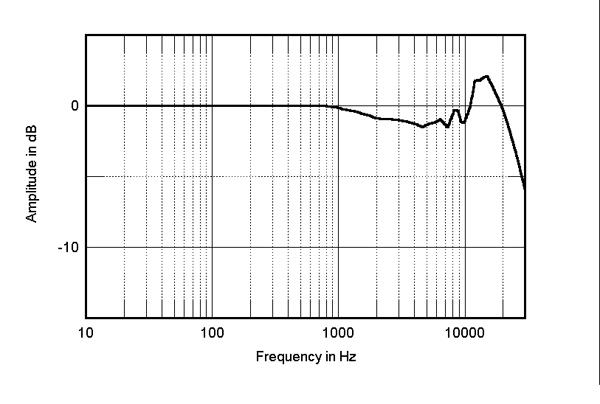
I then bumped into Paul Barton of PSB Loudspeakers at the June 1991 CES, who said he could have my microphone compared in an anechoic chamber with a calibrated reference B&K 4133 microphone flat to ±0.15dB. "Would I be interested?" he asked. "You betcha!" I replied, and arranged for Robert Harley to pay a visit to Paul up in the wilds of Canada. A reference loudspeaker was measured in the anechoic chamber first with the laboratory's mike and preamplifier, then with my microphone and EAR preamplifier. Subtracting the first loudspeaker response from the second gives the relative response of the Stereophile mike. This is shown from 30Hz to 20kHz in fig.2: while the general shape is the same as fig.1, the error is significantly larger, the top-octave rise reaching a maximum of +2.2dB at 14kHz and the low-treble trough dropping to –1.5dB at 4kHz.
Fig.2, B&K 4006 microphone, serial number 1039772, measured deviation form flat on-axis free-field response (5dB/vertical div.)
It was a relatively simple procedure to translate this error response into a computer data file that could be used to adjust the frequency-response data files produced by the MLSSA system. Stereophile's measured loudspeaker curves will therefore now be almost as accurate as if we had used the ultra-expensive B&K reference microphone. (I also extended the correction data to include the frequencies from 20kHz to 30kHz from the curve in fig.1, but there will be inherently a larger error in this region than below 20kHz; I don't feel this to be particularly important, as my main reason to show responses above 20kHz is to examine the ultrasonic behavior of tweeters, where absolute level accuracy is not as important as it is in the audio band.)
The first corrected response curves appeared in our September 1991 issue, but as I keep all the original data on every product we've measured in an archive folder (footnote 4), it seemed a good idea to compensate all previous published curves for the microphone's departure from flat and combine the results in a "Follow-Up" article to accompany this month's "Recommended Components." So, without further ado, here are the corrected anechoic frequency responses for nearly all the loudspeakers we have reviewed between Vol.12 No.10 (October 1989) and the present day, with a couple of extras, giving a total of 75 different samples representing 69 models.
Footnote 1: His second piece of advice was that a soldered joint couldn't be assumed to be sound unless it held together when you swung it around your head by the lead, something that holds just as true now as it did then. Footnote 2: "I have no academic training in physics, electronics, or acoustics." David Moran in Speaker Builder, Four/91, p.52.


