Sidebar 3: Measurements
After making sure the single Electro-Harmonix 12AU7/ECC82 dual-triode tube was firmly plugged into its socket under the top-panel window, I used my Audio Precision SYS2722 system to perform a full set of measurements on the Fezz Equinox. I then repeated some of the tests with the magazine's APx555 analyzer. (The results with the two systems were consistent.) As HR had told me he used the Equinox's USB and coaxial S/PDIF inputs for his auditioning, I used those inputs for the testing. I didn't use the two TosLink inputs, as these only worked with data sampled at 44.1kHz, and then only with one particular optical cable.
The coaxial input locked to data sampled at rates up to 192kHz. Apple's USB Prober utility identified the Equinox as "FEZZ" from "FEZZ" with the serial number string "413-001" and indicated that the USB port operated in the optimal isochronous asynchronous mode. The AudioMIDI utility revealed that the Equinox accepts 32-bit integer data via USB sampled at rates from 44.1kHz to 192kHz.
The unbalanced output impedance was extremely high, at 11.7k ohms at 20Hz, 9.8k ohms at 1kHz, and 7.4k ohms at 20kHz, presumably due to the output stage comprising an unbuffered tube; this is low enough to cause some reduction in output level with preamps with low input impedance. The processor's maximum output level isn't specified on the Fezz website or in the manual; I measured a maximum output level of 1.64V, which is 1.7dB lower than 2V, the CD standard. I asked HR if he had noticed anything about the Fezz processor's output; he responded that he found it "gain challenged."
The rear-panel signal ground switch was set to "On" for fig.4. I repeated the test with the switch set to "Off," then with the Audio Precision APx555 analyzer; there were no differences in the spectra. Although the mains cord supplied with the Equinox uses a standard three-pin plug, I floated the AC ground on that cord and again performed the low-frequency spectrum tests with the rear-panel switch in both positions. I then performed the spectral analyses with USB data from my MacBook Pro operating on battery power. There were no differences in any of these subsequent tests to what is shown in fig.4.
Footnote 1: See fig.9 here for what this waveform should look like.
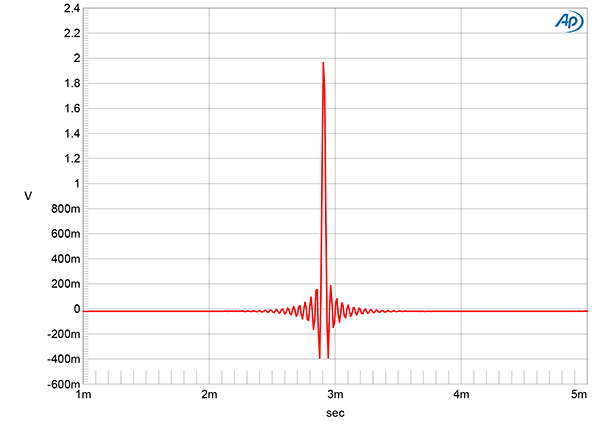
Fig.1 Fezz Equinox, impulse response (one sample at 0dBFS, 44.1kHz data, 4ms time window).
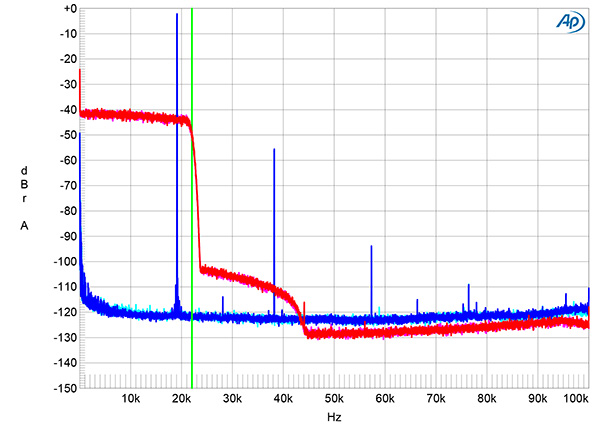
Fig.2 Fezz Equinox, wideband spectrum of white noise at –4dBFS (left channel red, right magenta) and 19.1kHz tone at 0dBFS (left blue, right cyan) into 100k ohms with data sampled at 44.1kHz (20dB/vertical div.).
The Equinox preserved absolute polarity. The processor's impulse response with data sampled at 44.1kHz (fig.1) is typical of a conventional linear-phase reconstruction filter, with symmetrical ringing before and after the single sample at 0dBFS. The magenta and red traces in fig.2 show the Fezz's wideband output spectrum with 44.1kHz white noise data at –4dBFS. There is a sharp rolloff just above the audioband, but full stopband attenuation isn't reached until 44.1kHz. The image at 25kHz of a 19.1kHz tone at 0dBFS (cyan, blue traces) is suppressed by >110dB, but the second harmonic of the tone lies at –54dB (0.5%).
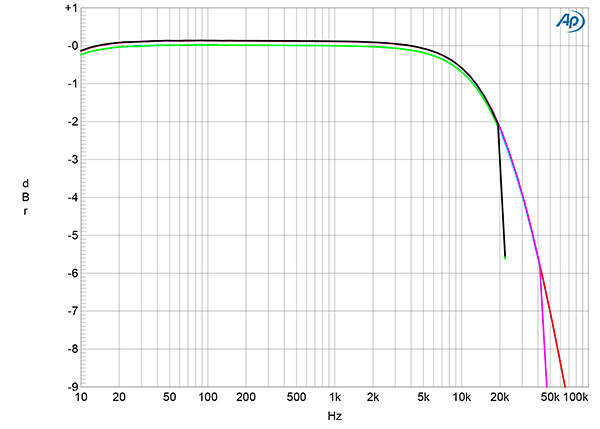
Fig.3 Fezz Equinox, frequency response at –12dBFS into 100k ohms with data sampled at: 44.1kHz (left channel green, right gray), 96kHz (left cyan, right magenta), and 192kHz (left blue, right red) (1dB/vertical div.).
The Equinox's frequency response with 44.1kHz, 96kHz, and 192kHz data (fig.3) follows the same basic shape, rolling off by 2dB at 20kHz with then a sharp rolloff just below half of each sample rate. The levels of the two channels are closely matched. Channel separation was moderate, at 57dB in both directions across the audioband. (I checked that I was measuring true crosstalk rather than noise by examining the waveform of the undriven channel's output on an oscilloscope.) The crosstalk level was not affected by using the switch on the back panel to connect or lift the signal ground.
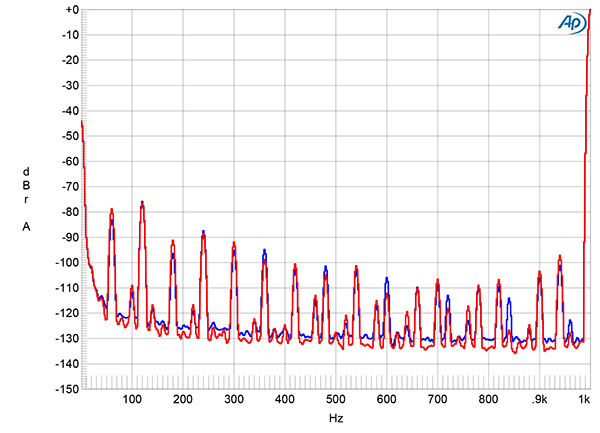
Fig.4 Fezz Equinox, spectrum of 24-bit 1kHz tone at 0dBFS, DC–1kHz (left channel blue, right red) (20dB/vertical div.).
This was also the case when I examined the low-frequency noisefloor (fig.4). Many power supply–related spuriae are present in this spectrum. The spuriae at 60Hz and its odd-order harmonics are due to magnetic interference from the power supply transformer, probably picked up by the output tube's steel pins. Although the transformer is a toroidal type, which should minimize magnetic leakage, the Equinox uses a steel chassis, which will exacerbate any interference present. The spuriae at 120Hz and the higher even-order harmonics of the 60Hz supply frequency is probably due to a nonzero impedance to ground somewhere in the circuit.
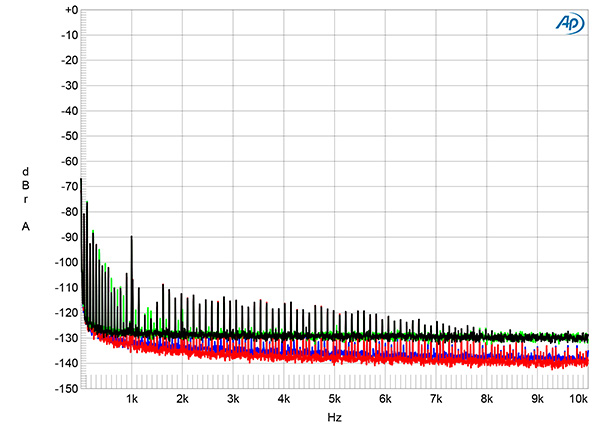
Fig.5 Fezz Equinox, spectrum with noise and spuriae of dithered 1kHz tone at –90dBFS with 16-bit data (left channel green, right gray) and 24-bit data (left blue, right red) (20dB/vertical div.).
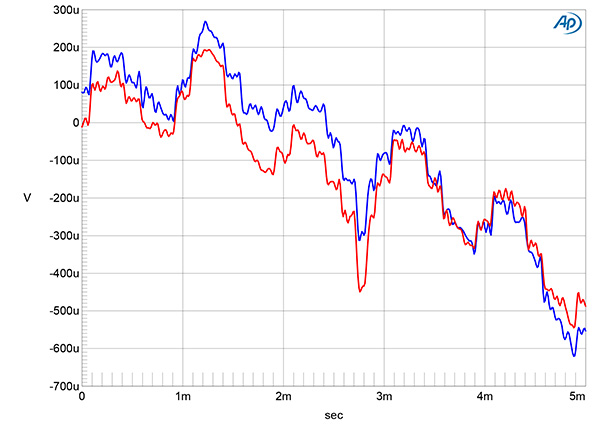
Fig.6 Fezz Equinox, waveform of undithered 1kHz sinewave at –90.31dBFS, 16-bit data (left channel blue, right red).
When I examined the Fezz's output spectra with 16- and 24-bit dithered data representing a 1kHz tone at –90dBFS, the increase in bit depth lowered the random noisefloor by 10dB (fig.5), which suggests a measured resolution of between 17 and 18 bits. However, the spectra in this graph are obscured by a large number of power supply–related spuriae. Although the lowest-frequency spuriae in fig.4 lie between –70dB and –80dB ref. 0dBFS, which might be thought to be sufficiently low, they affected the Equinox's reproduction of undithered data representing a 1kHz tone at exactly –90.31dBFS, which consists of data at –1LSB, digital zero, and +1LSB. The steps in the waveform represented by the data are obscured by the low-frequency spuriae (fig.6) (footnote 1).
Fig.7 Fezz Equinox, spectrum of 24-bit 1kHz sinewave, DC–1kHz, at 0dBFS into 100k ohms (left channel blue, right red, linear frequency scale).
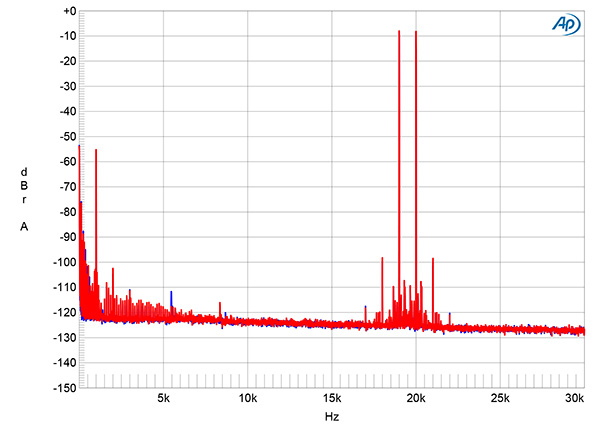
Fig.8 Fezz Equinox, HF intermodulation spectrum, DC–30kHz, 19+20kHz at 0dBFS into 100k ohms, 24-bit, 44.1kHz data (left channel blue, right red; linear frequency scale).
As expected from fig.2, the Fezz Equinox produced primarily second-harmonic distortion, this lying just below –50dB (0.3%) with a 1kHz signal at 0dBFS (fig.7). High-order intermodulation distortion with 24-bit data representing an equal mix of 19 and 20kHz tones, each at –6dBFS, was low in level (fig.8). However, the second-order difference product at 1kHz lay at –56dB (0.15%). Commendably, the harmonic and intermodulation distortion didn't rise in level when I repeated these tests with the punishing 600 ohm load.
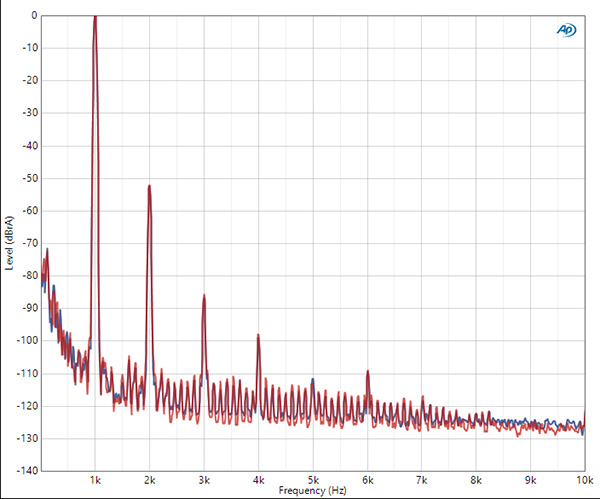
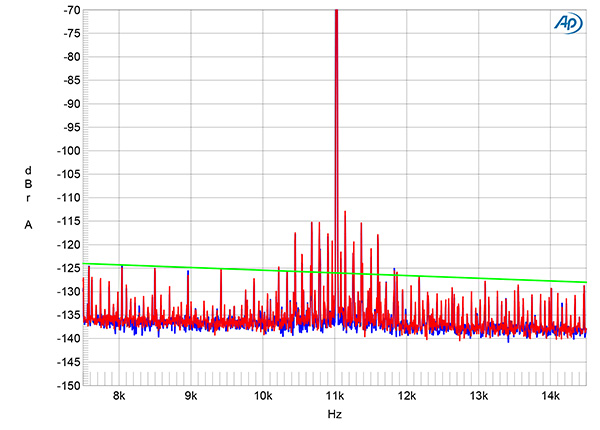
Fig.9 Fezz Equinox, 16-bit coaxial S/PDIF data, high-resolution jitter spectrum of analog output signal, 11.025kHz at –6dBFS, sampled at 44.1kHz with LSB toggled at 229Hz (left channel blue, right red). Center frequency of trace, 11.025kHz; frequency range, ±3.5kHz.
When I fed 16-bit J-Test data to the Equinox's coaxial input, the odd-order harmonics of the undithered low-frequency, LSB-level squarewave lay close to the correct levels, indicated by the green trace in fig.9. However, the spectrum was corrupted by a large number of power supply–related sidebands.
The AC-related spuriae observed in several measurements may be just low enough in level to avoid audibility except with very high-sensitivity speakers, but combined with the very high output impedance and the substantial levels of second harmonic and second-order intermodulation distortion, I found the measured performance of the Fezz Equinox disappointing.—John Atkinson
Footnote 1: See fig.9 here for what this waveform should look like.


