I measured the Ferrum Wandla with my Audio Precision SYS2722 system (see the January 2008 "As We See It"). As HR had told me he much preferred the sound with the optional Ferrum HYPSOS power supply, I performed a complete set of measurements using that supply (set to the appropriate 24.0V), then repeated some of the tests with the wall-wart.
Looking first at the Wandla's behavior as a D/A processor, Apple's USB Prober utility identified the Wandla as "Ferrum WANDLA" from "HEM" with the serial number string "12 mb=HEM014964;serce=HEM015368." The USB port operated in the optimal isochronous asynchronous mode, and Apple's AudioMIDI utility revealed that the Wandla accepted 24- and 32-bit integer data sampled at all rates from 44.1kHz to 768kHz. The AES3 and S/PDIF inputs accepted data sampled at rates up to 192kHz. HR had told me that he heard glitches with the Wandla decoding MQA data. I also found this to be the case. Something else I noticed was that while the front-panel display correctly showed the incoming data's sample rate for all rates of 48kHz and above, with 44.1kHz data, it sometimes said "48kHz." Nevertheless, the measured behavior with 44.1kHz data was correct.
With the Digital Input Trim set to "0dB," the Wandla's maximum output level at 1kHz with the balanced outputs feeding a high 100k ohm load was 10.3V. The Trim control operated in accurate 1dB steps down to the minimum setting of "–12dB." As usual, the maximum level from the unbalanced outputs was half those from the balanced outputs. The Wandla preserved absolute polarity (ie, was noninverting) from both output types. The balanced output impedance was the specified 44 ohms at all audio frequencies; the unbalanced output impedance was the specified 22 ohms.
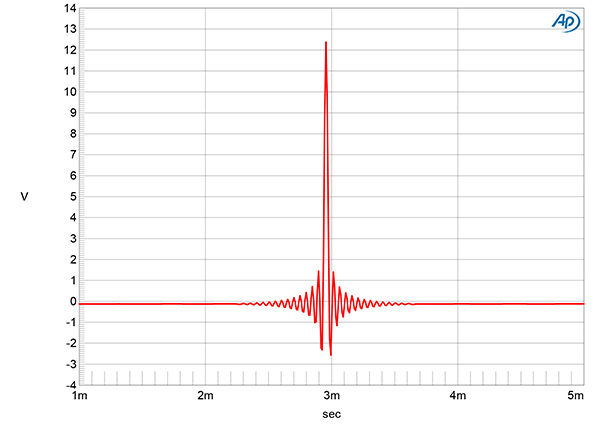
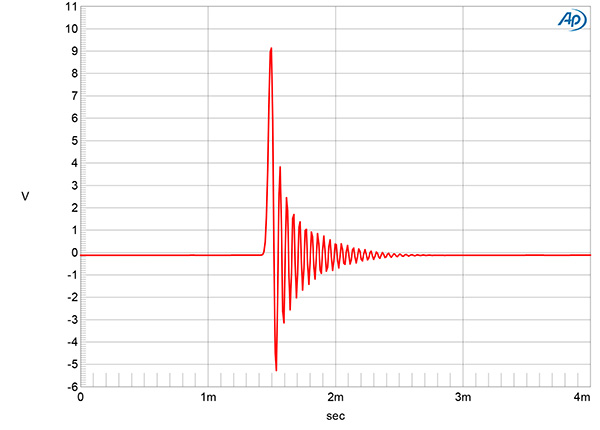
The Wandla offers a choice of five upsampling reconstruction filters: two from the creator of HQ Player, called HQ Gauss and HQ Apod., and three included in the ESS Sabre ES9038PRO DAC chip, called ESS Lin-Ph., ESS Min-Ph., and ESS Apod. Fig.1 shows the Wandla's impulse response with the HQ Gauss filter and 44.1kHz data. It is typical of a conventional linear-phase filter, with symmetrical ringing before and after the single full-scale sample. The impulse responses of the HQ Apod., ESS Lin-Ph., and ESS Apod. filters were identical to that of the HQ Gauss filter. The odd man out was the ESS Min-Ph. filter, which had a typical minimum-phase impulse response, with all the ringing following the single high sample (fig.2).
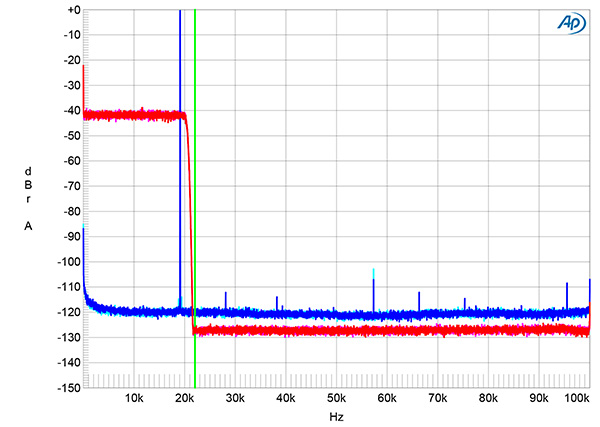
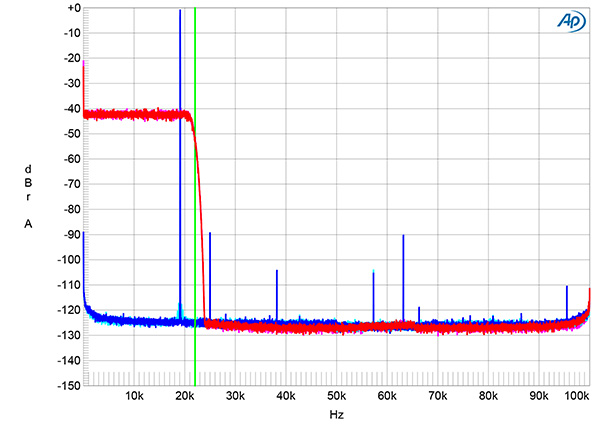
The magenta and red traces in fig.3 show the HQ Gauss filter's ultrasonic rolloff with data sampled at 44.1kHz. (The HQ Apod. filter's behavior was identical.) They reach full stop-band attenuation at just below half the sample rate (this indicated by the vertical green line), with complete suppression of the aliased image at 25kHz of a full-scale tone at 19.1kHz (cyan, blue). The harmonics associated with the 19.1kHz tone all lie at or below –108dB. These harmonics are a little higher in level with the three ESS filters (fig.4). Other than the ESS Apod. filter, full stop-band attenuation is reached at 24kHz, with the aliased image at 25kHz suppressed by 90dB.
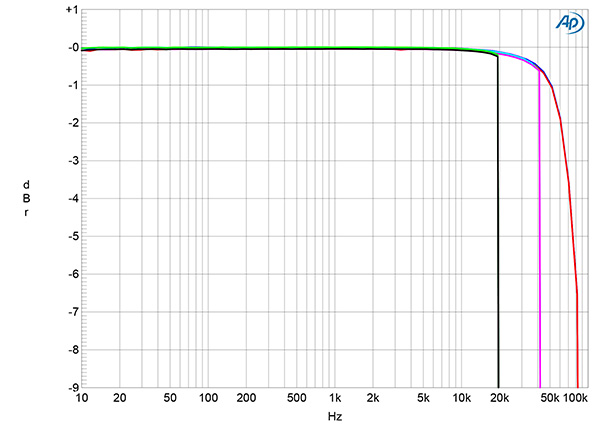
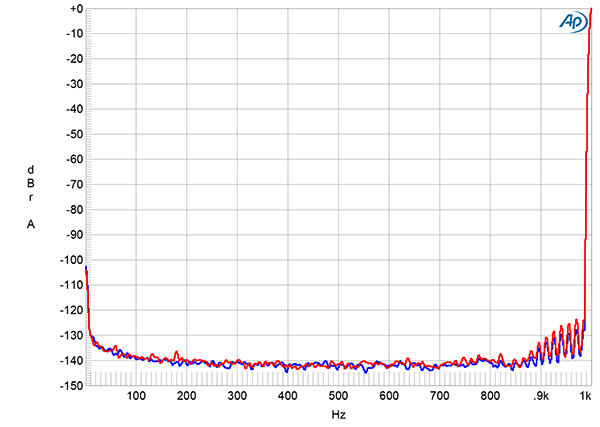
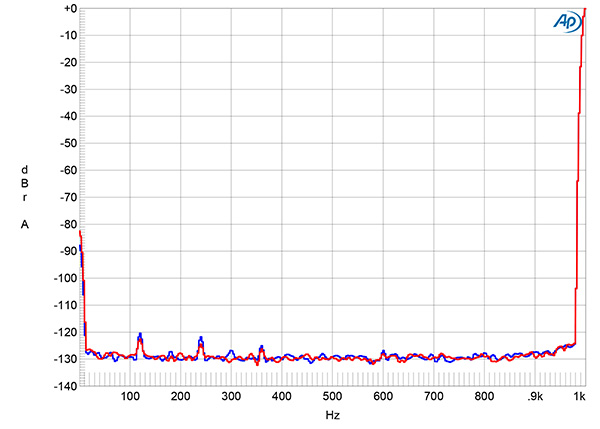
Fig.5 shows the HQ Gauss filter's frequency response with data sampled at 44.1, 96, and 192kHz. With 44.1kHz and 96kHz data, the output rolls off sharply just below half the sample rate. With 192kHz data, the response continues the initial gentle rolloff below 40kHz with 96kHz data, then rolls off quickly above 80kHz. Channel separation was superb, at >120dB in both directions below 3kHz, decreasing to a still superb 114dB at 20kHz. The Wandla's noisefloor with the HYPSOS (fig.6) was free from AC supply–related spuriae, but there are low-level sidebands visible around the spectral spike that represents a full-scale 1kHz tone at 2V into 100k ohms. These appear to be spaced at 35Hz, and they were also present when I repeated this analysis with the Wandla powered by the wall-wart supply. The random noisefloor is low with the HYPSOS supply but 6dB lower with the wall wart.
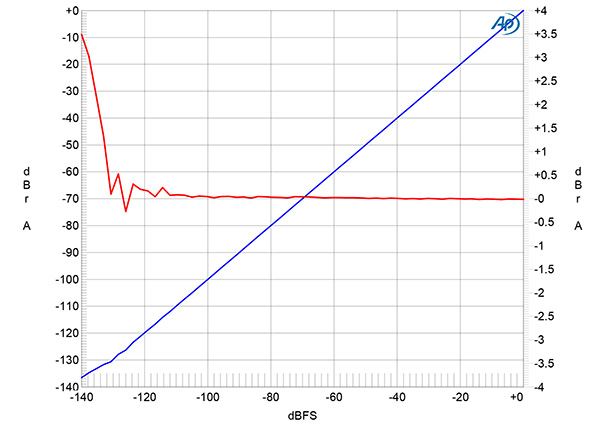
The red trace in fig.7 plots the error in the Ferrum's analog output level as a 24-bit, 1kHz digital tone stepped down from 0dBFS to –140dBFS. The error is <1dB down to –136dB, which implies very high resolution. An increase in bit depth from 16 to 24, with dithered data representing a 1kHz tone at –90dBFS, dropped the Wandla's noisefloor by 27dB (fig.8). This implies a resolution between 20 and 21 bits, which is up there with the best-measuring processors.
When I played undithered data representing a tone at exactly –90.31dBFS, the waveform was symmetrical, with negligible DC offset, and the three DC voltage levels described by the data were free from noise (fig.9). With undithered 24-bit data (fig.10), the Wandla output a clean sinewave, even at this very low signal level.
The Wandla produced very low levels of harmonic distortion with full-scale digital data into the high 100k ohm load (fig.11). The third harmonic was the only harmonic visible above the noisefloor; it lay at just –120dB (0.0001%). While the level of the third harmonic rose to –91dB (0.003%) when I reduced the load impedance to the punishing 600 ohms (fig.12), the third and higher harmonics were at or below –100dB.
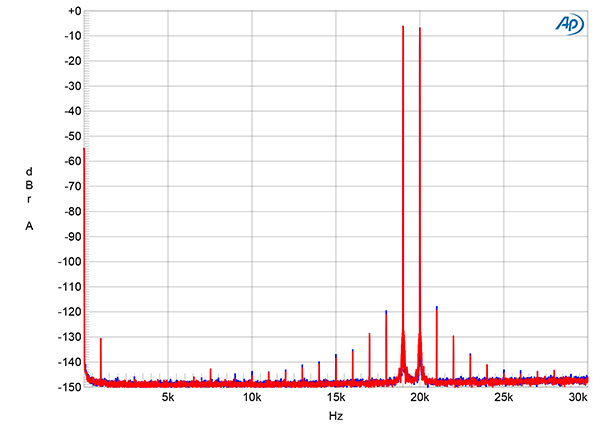
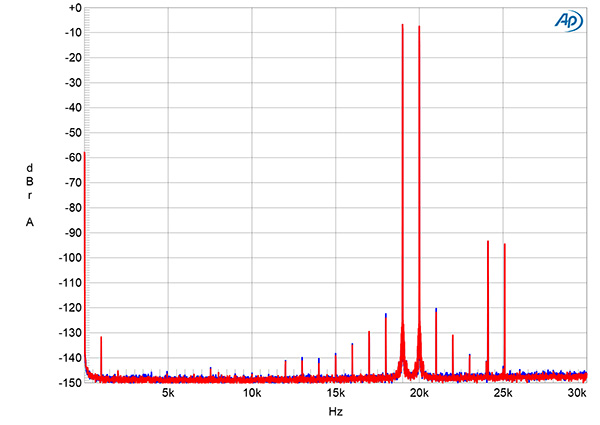
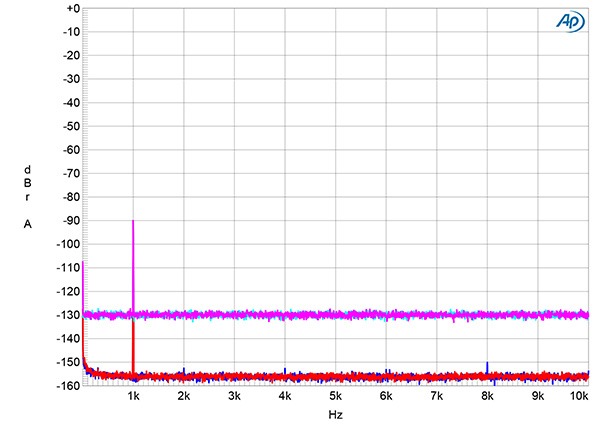
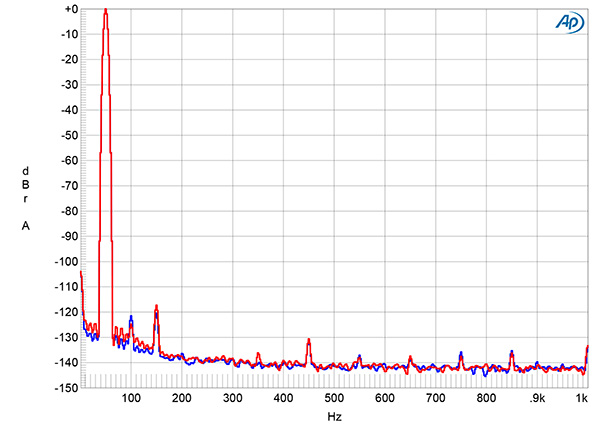
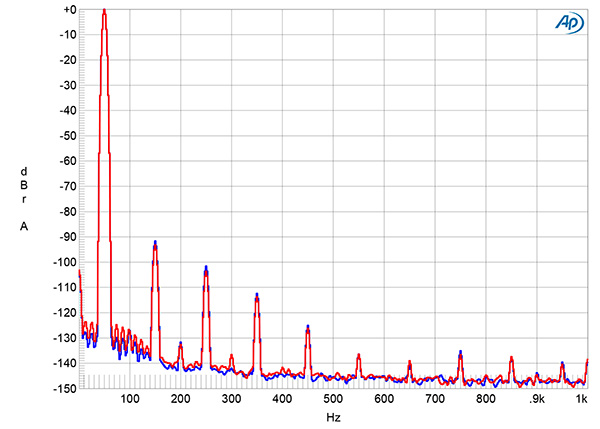
Intermodulation distortion with an equal mix of 19 and 20kHz tones, each at –6dBFS, was also very low (fig.13), with the difference tone at 1kHz lying at –130dB (0.00003%). This graph was taken with the HQ Gauss filter; the HQ Apod. filter behaved identically. The difference product was similarly low with the three ESS filters, but with them, aliased images of the primary tone can be been at –93dB (fig.14). Again, the Wandla wasn't fazed by the 600 ohm load, the intermodulation products remaining at the same ultralow level as they were into 100k ohms.
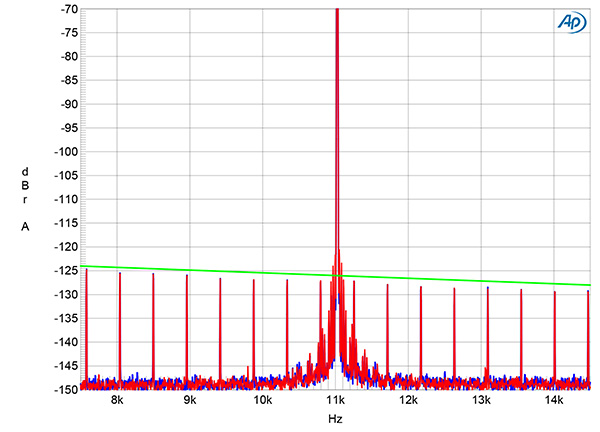
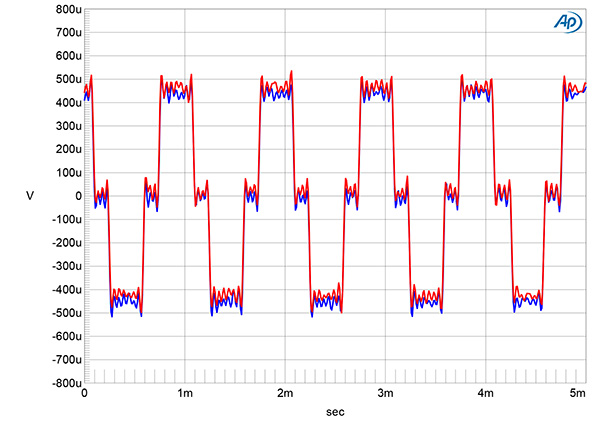
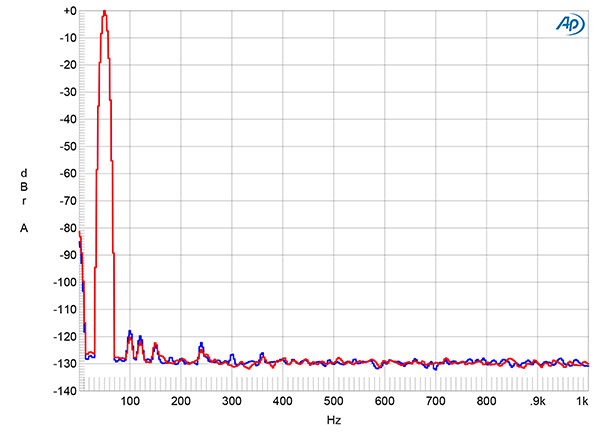
The Wandla offered excellent rejection of word-clock jitter via all its digital inputs. Fig.15 shows the spectrum of the Wandla's output when it was fed high-level 16-bit J-Test data via TosLink. All the odd-order harmonics of the undithered low-frequency, LSB-level squarewave lie at the correct levels, though the central spike that represents the high-level tone at one-quarter the sample rate (Fs/4) is surrounded by low-level sidebands spaced at the same 35Hz intervals I found in my low-frequency noisefloor analysis.?
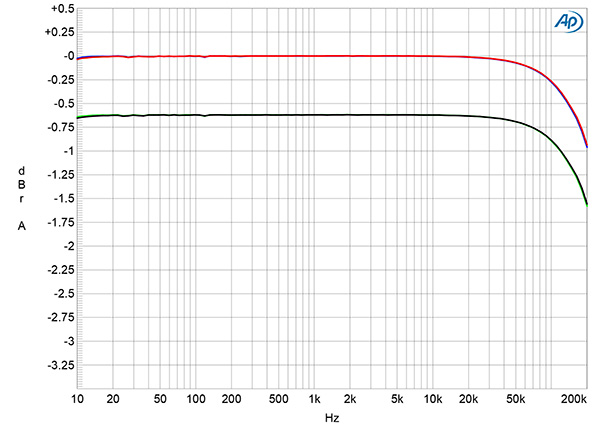
The single-ended analog line input preserved absolute polarity. With the Ferrum's Analog Input Gain set to 0dB and the volume control set to its maximum, the voltage gain at 1kHz measured 5.82dB from the balanced outputs and –0.21dB from the single-ended outputs. The Input Gain can be increased in accurate 1dB steps up to 12dB. The input impedance is specified as 47k ohms; I measured 45k ohms at 20Hz and 1kHz, 39.5k ohms at 20kHz. The analog frequency response (fig.16) was flat from 10Hz to 50kHz and down by –0.9dB at 200kHz. Channel separation was excellent, at >110dB below 3kHz and still 100dB at 20kHz.
With the Wandla's line input shorted to ground and the volume control set to its maximum with 0dB Analog Input Gain, the wideband, unweighted signal/noise ratio (ref. 1V) measured 73dB in both channels at the balanced outputs. Restricting the measurement bandwidth to the audioband increased that ratio to 99.3dB, and an A-weighting filter increased it further, to 102dB. Increasing the Analog Input Gain by 12dB reduced the unweighted ratios by 10dB. The Ferrum's analog input's low-frequency noisefloor (fig.17) was free from the 35Hz-spaced spuriae that I had found with the digital inputs.
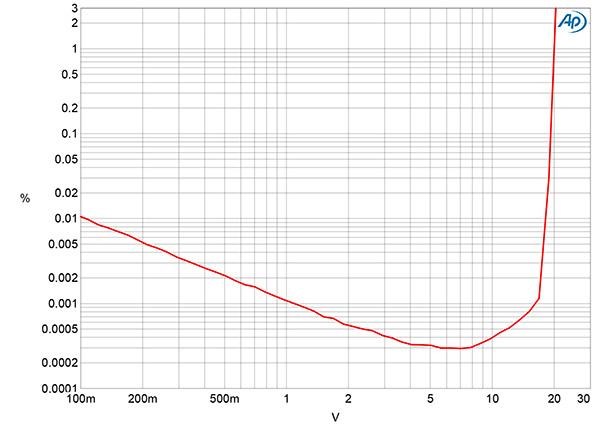
Fig.18 shows how the THD+noise percentage in the balanced output changed as the output voltage into 100k ohms increased. The downward slope below 5V output is due to actual distortion lying below the noisefloor. The distortion starts to rise above that output level but is still extraordinarily low. The balanced output clipped at a very high 20V into this load; the unbalanced output clipped at half that voltage, as expected. The balanced clipping voltage into the punishing 600 ohms load was 16.5V.
The distortion in both output types was extremely low at all audio frequencies, and the second- and third-harmonics lay at or below a vanishingly low –120dB (0.0001%) into high impedances (fig.19). This was the case with both the HYPSOS and wall-wart supplies.
Even when powered by its wall-wart supply, the Ferrum Wandla performed supremely well on the test bench with both analog and digital inputs, especially with the HQ Gauss reconstruction filter. It boasts very high resolution, very low distortion and noise, and a bombproof output stage.—John Atkinson


