Sidebar 3: Measurements As with some other massive speakers I've measured of late, it was not possible to move the B&W Signature 800 off the dolly onto which I'd had it unpacked and onto my Outline speaker turntable, let alone lift it far off the floor for the acoustic measurements. As a result, there was an unavoidable "floor bounce" of the speaker's output that contributed some visible roughness to some of the frequency-response graphs. The Signature 800 had a very high sensitivity, my estimate coming in at 92.5dB(B)/2.83V/m, slightly higher than the specified 91dB. I was therefore a little puzzled by Kal's finding the speaker to "suck power." However, its plot of impedance magnitude and phase (fig.1) does reveal the speaker to drop below 5 ohms for most of the midrange, with occasionally quite a high phase angle. At 73Hz, for example, a low impedance value of 3.94 ohms will be severely magnified by a capacitive phase angle of 55 degrees. As large-scale music tends to have a lot of energy in this region, a good, beefy amplifier is going to be necessary to drive the speaker to high levels, even with its high sensitivity. The saddle at 26Hz in the fig.1 magnitude trace indicates the tuning of the downward-firing port, while the wrinkle just above 30kHz reveals the presence of the metal-dome tweeter's "oil-can" resonance. This is the highest-frequency metal-dome resonance I have encountered. There is a glitch around 180Hz in both the magnitude and phase plots, which would seem to indicate the presence of some kind of panel or acoustic resonant mode at this frequency. Yet when I explored the two enclosures' vibrational behavior with a plastic-tape accelerometer, I found virtually nothing. The midrange head unit was free from any resonant modes, and the bass bin offered just one, very-low-level mode at 242Hz (fig.2).
 Fig.1 B&W Signature 800, electrical impedance (solid) and phase (dashed). (2 ohms/vertical div.)
  Fig.2 B&W Signature 800, cumulative spectral-decay plot of accelerometer output fastened to center of bass bin side panel. (MLS driving voltage to speaker, 7.55V; measurement bandwidth, 2kHz.) Fig.3 shows the responses of the midrange unit (magenta trace), the woofers (green), and the port (red), all measured in the nearfield. The blue trace is the complex sum ("complex" in that phase is taken into account) of the individual responses. As expected, the woofers have their minimum-motion point at the port tuning frequency, with the port broadly peaking at the same frequency. However, the latter's output appears to extend quite high in frequency before rolling off steeply above 375Hz; this may be spurious, due to acoustic leakage from the woofers. However, there is a small peak at the same 180Hz as the glitch in the impedance plots, though this is well down in level. Note that the reflex bass alignment is basically overdamped, which in all but very large rooms will give the optimal balance between low-frequency extension and definition. As KR described in his listening notes: "The Signature 800 is a big loudspeaker with very, very deep, powerful bass."
  Fig.3 B&W Signature 800, nearfield responses of midrange unit (magenta), woofers (green), port (red), and their complex sum (blue), plotted below 800Hz, 1kHz, 400Hz, and 800Hz, respectively.
The crossover between the woofers and midrange unit seems to be asymmetrical from the fig.3 traces, with a 24dB/octave high-pass slope to the midrange but an 18dB/octave low-pass to the woofers. When plotting a graph like this, I calculate the relative levels of the individual units by scaling them in the ratio of the radiating diameters (or the square roots of the total radiating areas, if there are multiple units). This gave an apparent crossover frequency of 280Hz in fig.3. However, the specified lower crossover frequency is actually 350Hz, which means that I appear to have plotted the midrange level around 3dB too high in level in this graph. The implications of this become clear when you look at fig.4, which shows the summed low-frequency response from fig.3 spliced at 400Hz to the nominal farfield response, averaged across a 30 degrees horizontal window on the tweeter axis. The upper two octaves of the midrange unit's output do appear to be smoothly shelved down compared with the lower midrange region. Quasi-anechoic measurement techniques lack resolution in the midrange, so I checked this measurement with a noise signal. The response trend was the same, so it appears to be real. Yet KR noted nothing amiss in the speaker's perceived in-room balance and B&W's own response graphs are impressively flat throughout this frequency region. An enigma.
Fig.3 B&W Signature 800, nearfield responses of midrange unit (magenta), woofers (green), port (red), and their complex sum (blue), plotted below 800Hz, 1kHz, 400Hz, and 800Hz, respectively.
The crossover between the woofers and midrange unit seems to be asymmetrical from the fig.3 traces, with a 24dB/octave high-pass slope to the midrange but an 18dB/octave low-pass to the woofers. When plotting a graph like this, I calculate the relative levels of the individual units by scaling them in the ratio of the radiating diameters (or the square roots of the total radiating areas, if there are multiple units). This gave an apparent crossover frequency of 280Hz in fig.3. However, the specified lower crossover frequency is actually 350Hz, which means that I appear to have plotted the midrange level around 3dB too high in level in this graph. The implications of this become clear when you look at fig.4, which shows the summed low-frequency response from fig.3 spliced at 400Hz to the nominal farfield response, averaged across a 30 degrees horizontal window on the tweeter axis. The upper two octaves of the midrange unit's output do appear to be smoothly shelved down compared with the lower midrange region. Quasi-anechoic measurement techniques lack resolution in the midrange, so I checked this measurement with a noise signal. The response trend was the same, so it appears to be real. Yet KR noted nothing amiss in the speaker's perceived in-room balance and B&W's own response graphs are impressively flat throughout this frequency region. An enigma. 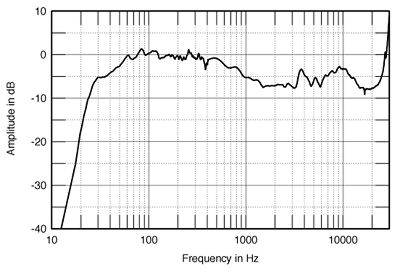 Fig.4 B&W Signature 800, anechoic response on tweeter axis at 50", averaged across 30 degrees horizontal window and corrected for microphone response, with the complex sum of the nearfield responses plotted below 400Hz.
Fig.1 B&W Signature 800, electrical impedance (solid) and phase (dashed). (2 ohms/vertical div.) Fig.2 B&W Signature 800, cumulative spectral-decay plot of accelerometer output fastened to center of bass bin side panel. (MLS driving voltage to speaker, 7.55V; measurement bandwidth, 2kHz.) Fig.3 shows the responses of the midrange unit (magenta trace), the woofers (green), and the port (red), all measured in the nearfield. The blue trace is the complex sum ("complex" in that phase is taken into account) of the individual responses. As expected, the woofers have their minimum-motion point at the port tuning frequency, with the port broadly peaking at the same frequency. However, the latter's output appears to extend quite high in frequency before rolling off steeply above 375Hz; this may be spurious, due to acoustic leakage from the woofers. However, there is a small peak at the same 180Hz as the glitch in the impedance plots, though this is well down in level. Note that the reflex bass alignment is basically overdamped, which in all but very large rooms will give the optimal balance between low-frequency extension and definition. As KR described in his listening notes: "The Signature 800 is a big loudspeaker with very, very deep, powerful bass." Fig.3 B&W Signature 800, nearfield responses of midrange unit (magenta), woofers (green), port (red), and their complex sum (blue), plotted below 800Hz, 1kHz, 400Hz, and 800Hz, respectively. Fig.4 B&W Signature 800, anechoic response on tweeter axis at 50", averaged across 30 degrees horizontal window and corrected for microphone response, with the complex sum of the nearfield responses plotted below 400Hz.


