
In the time domain, the 805's impulse response (fig.8) is typical of the type—a high-order crossover and a metal-dome tweeter—though the step response calculated from fig.15 (fig.9) reveals that the drive-units are not time-coherent on the HF axis, despite the tweeter's being set back on top of the baffle. The sharp up/down spike is the tweeter's output, followed a fraction of a millisecond later by the midrange/woofer, which has the same acoustic polarity. And moving the microphone down to the port axis so that the woofer's output is moved forward in time a little relative to the tweeter doesn't change the step response much. Fig.10, the waterfall plot derived from the fig.8 data, is exceptionally clean, however, this contributing to the speaker's highly transparent presentation. There is a slight hint of a resonant mode just below 4kHz, but this is very minor. 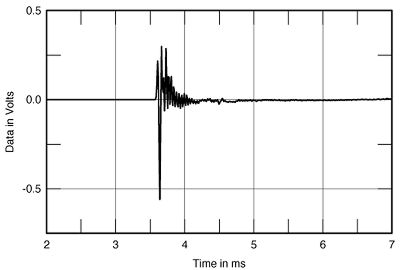 Fig.8 B&W Matrix 805, impulse response on tweeter axis at 45" (5ms time window, 30kHz bandwidth).
 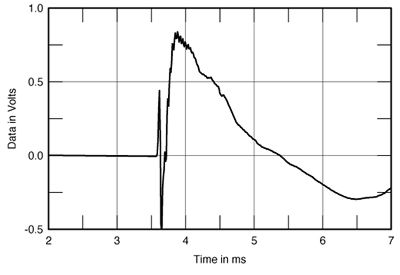 Fig.9 B&W Matrix 805, step response on tweeter axis at 45" (5ms time window, 30kHz bandwidth).
 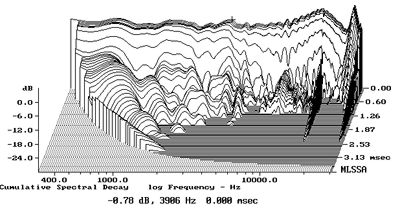 Fig.10 B&W Matrix 805, cumulative spectral-decay plot at 45" (0.15ms risetime). Finally, I taped a PVDF accelerometer to the side of the 805's woofer enclosure and drove the speaker with 7.5V of 2kHz MLS noise (footnote 1). Calculating the cumulative spectral-decay plot from the resultant impulse response gives the waterfall graph of fig.11. Only one real cabinet resonance can be seen, at the high frequency of 516Hz. But note the vertical scale: this resonance is very low in absolute level; in fact, plotting it to the vertical scale we normally use (fig.12) reveals the efficacy of B&W's "Matrix" cabinet construction in suppressing resonances. For comparison, fig.13 shows the resonant behavior of the Spica SC-30's cabinet sidewall, plotted to the same scale.
 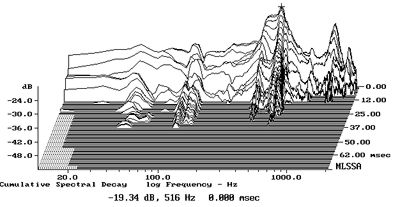 Fig.11 B&W Matrix 805, cumulative spectral-decay plot calculated from the output of an accelerometer fastened to the cabinet's side panel. (MLS driving voltage to speaker, 7.55V; measurement bandwidth, 2kHz.)
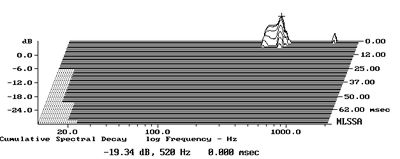 Fig.12 B&W Matrix 805, cumulative spectral-decay plot calculated from the output of an accelerometer fastened to the cabinet's side panel. (MLS driving voltage to speaker, 7.55V; measurement bandwidth, 2kHz.)
 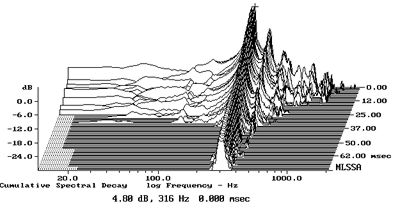 Fig.13 Spica SC-30, cumulative spectral-decay plot calculated from the output of an accelerometer fastened to the cabinet's side panel. (MLS driving voltage to speaker, 7.55V; measurement bandwidth, 2kHz.) All in all, these are an excellent set of measurements which go some way to explaining why LG was impressed with the 805's sound quality and indicate the 805 to be an extremely well-engineered little speaker.—John Atkinson
Footnote 1: See Stereophile, Vol.15 No.6, June 1992, pp.205-207.—John Atkinson
Fig.8 B&W Matrix 805, impulse response on tweeter axis at 45" (5ms time window, 30kHz bandwidth). Fig.9 B&W Matrix 805, step response on tweeter axis at 45" (5ms time window, 30kHz bandwidth). Fig.10 B&W Matrix 805, cumulative spectral-decay plot at 45" (0.15ms risetime). Finally, I taped a PVDF accelerometer to the side of the 805's woofer enclosure and drove the speaker with 7.5V of 2kHz MLS noise (footnote 1). Calculating the cumulative spectral-decay plot from the resultant impulse response gives the waterfall graph of fig.11. Only one real cabinet resonance can be seen, at the high frequency of 516Hz. But note the vertical scale: this resonance is very low in absolute level; in fact, plotting it to the vertical scale we normally use (fig.12) reveals the efficacy of B&W's "Matrix" cabinet construction in suppressing resonances. For comparison, fig.13 shows the resonant behavior of the Spica SC-30's cabinet sidewall, plotted to the same scale. Fig.11 B&W Matrix 805, cumulative spectral-decay plot calculated from the output of an accelerometer fastened to the cabinet's side panel. (MLS driving voltage to speaker, 7.55V; measurement bandwidth, 2kHz.) Fig.12 B&W Matrix 805, cumulative spectral-decay plot calculated from the output of an accelerometer fastened to the cabinet's side panel. (MLS driving voltage to speaker, 7.55V; measurement bandwidth, 2kHz.) Fig.13 Spica SC-30, cumulative spectral-decay plot calculated from the output of an accelerometer fastened to the cabinet's side panel. (MLS driving voltage to speaker, 7.55V; measurement bandwidth, 2kHz.) All in all, these are an excellent set of measurements which go some way to explaining why LG was impressed with the 805's sound quality and indicate the 805 to be an extremely well-engineered little speaker.—John Atkinson Footnote 1: See Stereophile, Vol.15 No.6, June 1992, pp.205-207.—John Atkinson