Sidebar 3: Measurements
I used DRA Labs' MLSSA system, a calibrated DPA 4006 microphone, and an Earthworks microphone preamplifier to measure the Bowers & Wilkins 804 D4's frequency response in the farfield. My primary axis for the measurements was level with the tweeter, but I also performed a series of tests on an axis level with the midrange unit, which is 36" from the floor, the height of my ears in my listening chair. I used an Earthworks QTC-40 mike for the nearfield and in-room responses.
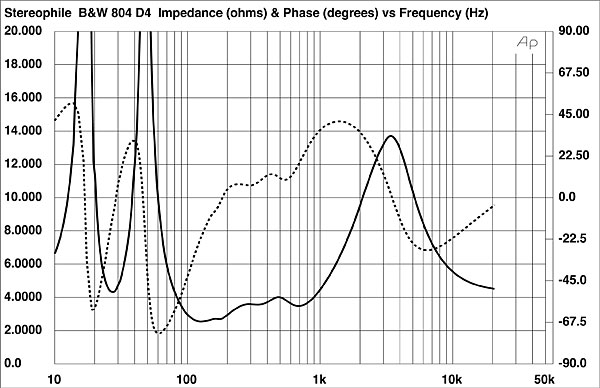
Bowers & Wilkins specifies the 804 D4's anechoic sensitivity as 89dB/2.83V/m. My B-weighted estimate was the same. The 804 D4's impedance is specified as 8 ohms, with a minimum value of 3 ohms. The solid trace in fig.1 indicates that the impedance magnitude, measured with Dayton Audio's DATS v2 system, lies between 3 and 6 ohms in the upper bass and midrange, with a minimum value of 2.55 ohms between 121Hz and 131Hz. The electrical phase angle (dashed trace) is occasionally high; for example, there is a current-hungry combination of 3.7 ohms magnitude and –55° phase angle at 87Hz. The effective resistance, or EPDR (footnote 1), drops below 2 ohms between 22Hz and 33Hz, 62Hz and 116Hz, and 663Hz and 886Hz. The minimum EPDR is 1 ohm from 88Hz to 110Hz and 1.6 ohms at 886Hz. The 804 D4 must be used with amplifiers that don't have problems driving 2 ohms.
 The output of the woofers crosses over to the midrange unit's output (fig.3, green trace below 4kHz) around 450Hz, with a steep high-frequency rolloff. The response of the midrange unit, measured on the tweeter axis, appears to be a little lower in level than that of the tweeter; their combined output is disturbed by a small, narrow peak just below 4kHz and a suckout between 5kHz and 7kHz.
The black trace below 300Hz in fig.4 is the complex sum of the Bowers & Wilkins's nearfield woofer and port responses. The peak in the upper bass, which is due in part to the nearfield measurement technique, is not as fully developed as usual. From my auditioning, I suspect that the woofer alignment is somewhat overdamped, favoring articulation over ultimate low-frequency extension.
The output of the woofers crosses over to the midrange unit's output (fig.3, green trace below 4kHz) around 450Hz, with a steep high-frequency rolloff. The response of the midrange unit, measured on the tweeter axis, appears to be a little lower in level than that of the tweeter; their combined output is disturbed by a small, narrow peak just below 4kHz and a suckout between 5kHz and 7kHz.
The black trace below 300Hz in fig.4 is the complex sum of the Bowers & Wilkins's nearfield woofer and port responses. The peak in the upper bass, which is due in part to the nearfield measurement technique, is not as fully developed as usual. From my auditioning, I suspect that the woofer alignment is somewhat overdamped, favoring articulation over ultimate low-frequency extension.
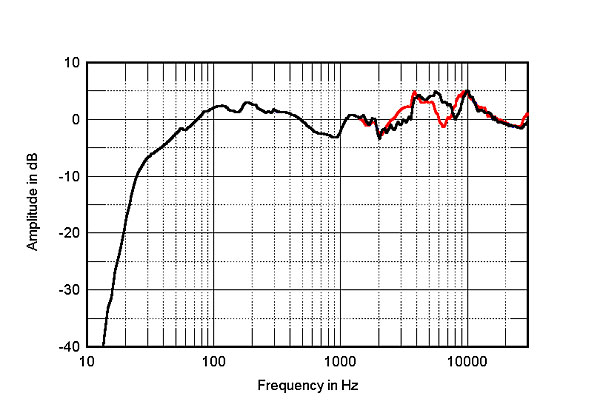 The red trace in fig.4 shows the 804 D4's farfield response, averaged across a 30° horizontal window centered on the tweeter axis; the black trace shows the farfield response, averaged across a 30° horizontal window centered on the midrange axis. Like the 705 Signature, both traces have an excess of energy between 3.5kHz and 15kHz. However, the suckout between 6kHz and 7kHz on the tweeter axis fills in on the midrange axis to be replaced by a smaller suckout centered on 8kHz. The responses in fig.4 were taken without the small grilles; repeating the tweeter-axis measurement with the grilles resulted in very little change. Commendably, both samples' frequency responses matched within 0.5dB.
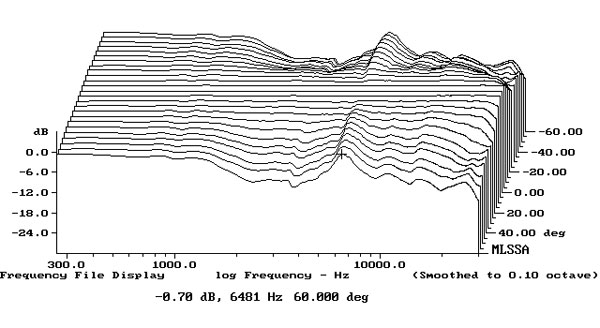
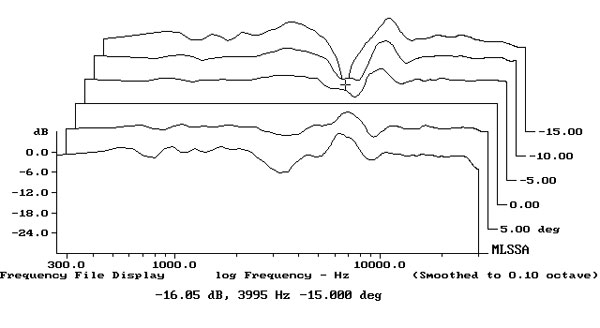
Fig.5 shows the 804 D4's horizontal dispersion, normalized to the response on the tweeter axis, which thus appears as a straight line. The contour lines in this graph are smooth and evenly spaced, correlating with the stable stereo imaging I noted in my auditioning. There is a slight lack of presence-region energy to the speaker's sides, while the ridge of off-axis energy at the cursor position reveals that the on-axis suckout in that region tends to fill in to the 804 D4's sides. In the vertical plane (fig.6), the mid-treble suckout in the Bowers & Wilkins's response fills in as expected on the midrange axis. A notch at 4kHz appears 15° above the tweeter axis, which suggests that this is the crossover frequency between the midrange unit and the tweeter.
The red trace in fig.4 shows the 804 D4's farfield response, averaged across a 30° horizontal window centered on the tweeter axis; the black trace shows the farfield response, averaged across a 30° horizontal window centered on the midrange axis. Like the 705 Signature, both traces have an excess of energy between 3.5kHz and 15kHz. However, the suckout between 6kHz and 7kHz on the tweeter axis fills in on the midrange axis to be replaced by a smaller suckout centered on 8kHz. The responses in fig.4 were taken without the small grilles; repeating the tweeter-axis measurement with the grilles resulted in very little change. Commendably, both samples' frequency responses matched within 0.5dB.
Fig.5 shows the 804 D4's horizontal dispersion, normalized to the response on the tweeter axis, which thus appears as a straight line. The contour lines in this graph are smooth and evenly spaced, correlating with the stable stereo imaging I noted in my auditioning. There is a slight lack of presence-region energy to the speaker's sides, while the ridge of off-axis energy at the cursor position reveals that the on-axis suckout in that region tends to fill in to the 804 D4's sides. In the vertical plane (fig.6), the mid-treble suckout in the Bowers & Wilkins's response fills in as expected on the midrange axis. A notch at 4kHz appears 15° above the tweeter axis, which suggests that this is the crossover frequency between the midrange unit and the tweeter.
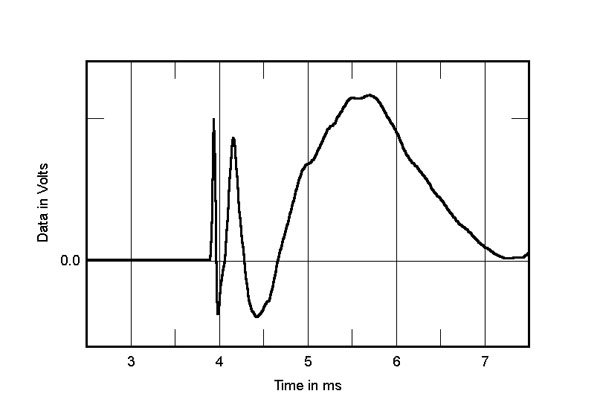
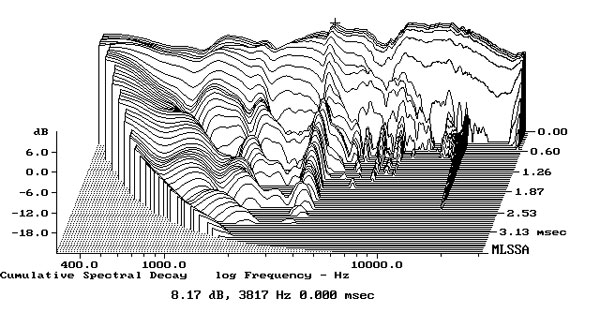
 In the time domain, the 804 D4's step response on the tweeter axis (fig.8) reveals that all the drive units are connected in positive acoustic polarity, with each drive unit's step smoothly blending with the start of the next-lower-in-frequency unit's step. The 804 D4's cumulative spectral-decay plot on the tweeter axis (fig.9) is clean in the midrange and treble but is marred by a ridge of delayed energy at 3.8kHz, the frequency of the narrow peak in the farfield response.
Footnote 1: EPDR is the resistive load that gives rise to the same peak dissipation in an amplifier's output devices as the loudspeaker. See "Audio Power Amplifiers for Loudspeaker Loads," JAES, Vol.42 No.9, September 1994, and stereophile.com/reference/707heavy/index.html.
Footnote 2: Using the FuzzMeasure 3.0 program, a Metric Halo MIO2882 FireWire-connected audio interface, and a 96kHz sample rate, I average 20 1/6-octave–smoothed spectra, individually taken for the left and right speakers, in a rectangular grid 36" wide by 18" high and centered on the positions of my ears.
Footnote 3: A loudspeaker that offers a flat on-axis response and well-controlled lateral dispersion gives a gently sloped-down treble in its spatially averaged room response due to the increased absorption of the room's furnishings and the narrowing of the tweeter's radiation pattern at high frequencies.
Fig.1 Bowers & Wilkins 804 D4, electrical impedance (solid) and phase (dashed) (2 ohms/vertical div.).
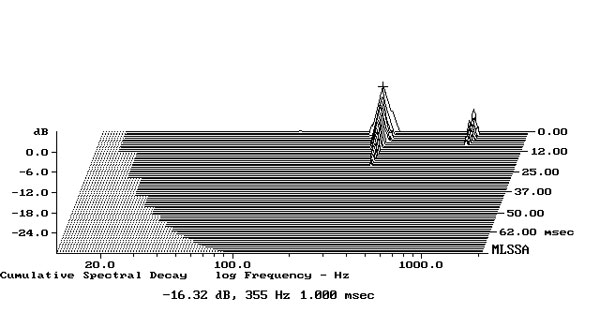
The traces in fig.1 are free from the small discontinuities that would imply resonances of some kind. When I investigated the enclosure's vibrational behavior with a plastic-tape accelerometer, all the panels were relatively inert. The only resonant mode I found was on the sidewalls at 355Hz (fig.2), but this is very low in level and has a high Q (Quality Factor). (The higher the Q of a resonance, the lower the possibility that it will be excited.)
Fig.2 Bowers & Wilkins 804 D4, cumulative spectral-decay plot calculated from output of accelerometer fastened to center of side panel midway between the woofers (MLS driving voltage to speaker, 7.55V; measurement bandwidth, 2kHz).
The blue trace below 350Hz in fig.3 shows the sum of the nearfield outputs of the two woofers, which behave identically. The minimum-motion notch in their outputs, which is when the back pressure from the port resonance holds their diaphragms stationary, lies at a low 28Hz, which coincides with the center of the saddle in the low-frequency impedance-magnitude trace. The red trace shows the response of the downward-firing port, measured with the microphone capsule inserted into the space between the flared port opening and the aluminum bottom plate. The port's output peaks at the tuning frequency in textbook fashion, but its upper-frequency rolloff is disturbed by two high-amplitude, high-Q peaks, at 308Hz and 567Hz. Peculiarly, this behavior doesn't have any effect on the output of the woofers. All I can think of is that the resonances that cause these two peaks occur in the airspace below the port opening. In any case the fact that the port faces the floor—together with the peaks' high-Q—should minimize the audible consequences of this behavior.
Fig.3 Bowers & Wilkins 804 D4, acoustic crossover on tweeter axis at 50", corrected for microphone response, with the nearfield response of the midrange unit (green), the summed nearfield responses of the woofers (blue), and the port (red), respectively plotted below 600Hz, 1.8kHz, and 900Hz.
Fig.4 Bowers & Wilkins 804 D4, anechoic response on midrange axis (black) and tweeter axis (red) at 50", averaged across 30° horizontal window and corrected for microphone response, with the sum of the nearfield plotted below 300Hz.
Fig.5 Bowers & Wilkins 804 D4, lateral response family at 50", normalized to response on tweeter axis, from back to front: differences in response 60–5° off axis, reference response, differences in response 5–60° off axis.
Fig.6 Bowers & Wilkins 804 D4, vertical response family at 50", normalized to response on tweeter axis, from back to front: differences in response 15–5° above axis, reference response, differences in response 5–10° below axis.
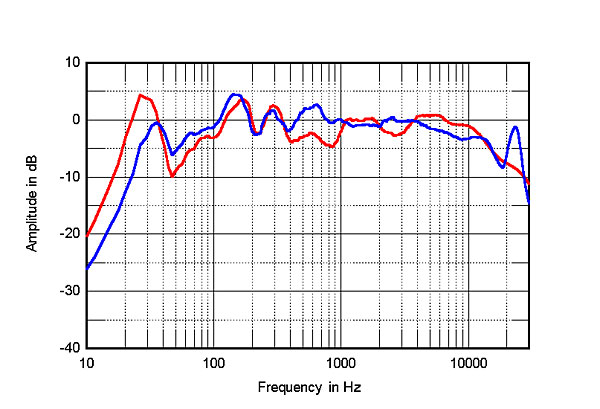
The red trace in fig.7 shows the Bowers & Wilkins 804 D4s' spatially averaged response at their final positions in my room. (The spatial averaging (footnote 2) tends to average out the peaks and dips below 400Hz that are due to the room's resonant modes.) For reference, the blue trace shows the spatially averaged response of the PSB Synchrony T600s, which had some of their ports blocked, as I discussed in my review in the November 2021 issue. The Bowers & Wilkinses excite the lowest frequency mode just above 30Hz in my room to a greater extent than the PSBs and have less output in the upper midrange. While the T600s have the usual gentle downward slope in the top two audio octaves (footnote 3), I did find their highs to sound somewhat mellow. By contrast, the 804 D4s have greater output in the mid-treble, which is what I heard.
Fig.7 Bowers & Wilkins 804 D4, spatially averaged, 1/6-octave response in JA's listening room (red) and of the PSB Synchrony T600 (blue).
Fig.8 Bowers & Wilkins 804 D4, step response on tweeter axis at 50" (5ms time window, 30kHz bandwidth).
Fig.9 Bowers & Wilkins 804 D4, cumulative spectral-decay plot on tweeter axis at 50" (0.15ms risetime).
The Bowers & Wilkins 804 D4's measured performance is enigmatic, with positive aspects—the relatively high sensitivity, the superbly quiet enclosure, the well-controlled dispersion, and the excellent pair matching—that must be set against others, like the demanding impedance, the excessive high frequencies, and the resonances in the port's and upper-frequency units' output.—John Atkinson
Footnote 1: EPDR is the resistive load that gives rise to the same peak dissipation in an amplifier's output devices as the loudspeaker. See "Audio Power Amplifiers for Loudspeaker Loads," JAES, Vol.42 No.9, September 1994, and stereophile.com/reference/707heavy/index.html.


