Sidebar 3: Measurements
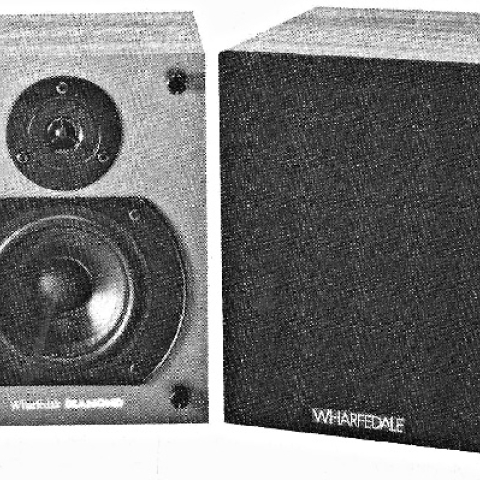
The Studio 3's impedance (fig.1) doesn't drop below 8 ohms, making it a very easy amplifier load. (This graph nicely illustrates the facts that maximum electrical phase angles occur at relatively high magnitude values, and that both maximum- and minimum-magnitude values coincide with 0° phase.) The sealed box is tuned to 93Hz (the peak at that frequency reaches 21.7 ohms), significantly higher than either of the other two loudspeakers reviewed. No wrinkles in the lower midrange can be seen, implying a relatively well-braced cabinet construction. The sensitivity, measured using B-weighted noise, was a dB or so higher than that of the LS3/5a, at a calculated 83.5dB/W/m.
 Fig.1 Rogers Studio 3, electrical impedance (solid) and phase (dashed) (2 ohms/vertical div.).
Looking at the individual responses of the woofer and tweeter (fig.2) reveals a crossover set at 2.5kHz, with very steep acoustic slopes. The woofer is a mite peaky on-axis at the top of its passband, which correlates with the slight coloration noted. When its output is added to that of the tweeter in the overall response (fig.3), the result is exaggerated by the overlap between the drivers. Other than that, however, the response is commendably flat. The woofer tuning appears to be classically overdamped, gently rolling off below 150Hz without a hint of any upper-bass peak, reaching its –6dB point at 90Hz, half an octave higher than the Harbeth speakers. Remember, however, that unlike the other speakers, which are free-space designs, the Studio 3 is intended to be used close to the wall behind it, which will boost its in-room bass.
Fig.1 Rogers Studio 3, electrical impedance (solid) and phase (dashed) (2 ohms/vertical div.).
Looking at the individual responses of the woofer and tweeter (fig.2) reveals a crossover set at 2.5kHz, with very steep acoustic slopes. The woofer is a mite peaky on-axis at the top of its passband, which correlates with the slight coloration noted. When its output is added to that of the tweeter in the overall response (fig.3), the result is exaggerated by the overlap between the drivers. Other than that, however, the response is commendably flat. The woofer tuning appears to be classically overdamped, gently rolling off below 150Hz without a hint of any upper-bass peak, reaching its –6dB point at 90Hz, half an octave higher than the Harbeth speakers. Remember, however, that unlike the other speakers, which are free-space designs, the Studio 3 is intended to be used close to the wall behind it, which will boost its in-room bass.
 Fig.2 Rogers Studio 3, acoustic crossover on tweeter axis at 50", corrected for microphone response, with nearfield woofer response plotted below 300Hz.
 Fig.3 Rogers Studio 3, anechoic response on tweeter axis at 50", averaged across 30° horizontal window and corrected for microphone response, with woofer responses plotted below 300Hz.
This can be seen from the spatially averaged in-room response taken with the Studio 3s in the same positions as the LS3/5a (fig.4). The entire bass region can be seen to be shelved down, with a slight rising trend through the midrange and treble. The Rogers's lateral dispersion (fig.5) is less even than the Harbeth HL-P3's, some peakiness developing off-axis in the mid-treble, with a trough in the upper midrange. The top octave is maintained to 15° off-axis but drops off rapidly at more extreme angles. In the vertical plane (fig.6), there is very little change in the response unless the listener moves below the woofer axis or more than 7.5° above the top of the cabinet. Stand height should therefore be less critical than with the other speakers reviewed.
Fig.3 Rogers Studio 3, anechoic response on tweeter axis at 50", averaged across 30° horizontal window and corrected for microphone response, with woofer responses plotted below 300Hz.
This can be seen from the spatially averaged in-room response taken with the Studio 3s in the same positions as the LS3/5a (fig.4). The entire bass region can be seen to be shelved down, with a slight rising trend through the midrange and treble. The Rogers's lateral dispersion (fig.5) is less even than the Harbeth HL-P3's, some peakiness developing off-axis in the mid-treble, with a trough in the upper midrange. The top octave is maintained to 15° off-axis but drops off rapidly at more extreme angles. In the vertical plane (fig.6), there is very little change in the response unless the listener moves below the woofer axis or more than 7.5° above the top of the cabinet. Stand height should therefore be less critical than with the other speakers reviewed.
 Fig.4 Rogers Studio 3, spatially averaged 1/3-octave response in JA's listening room.
 Fig.5 Rogers Studio 3, horizontal response family at 50", normalized to response on tweeter axis, from back to front: differences in response 90°–5° off-axis; reference response; differences in response 5°–90° off-axis.
 Fig.6 Rogers Studio 3, vertical response family at 50", normalized to response on tweeter axis, from back to front: differences in response 15°–5° above tweeter axis; reference response; differences in response 5°–10° below tweeter axis.
The impulse (fig.7) and step (fig.8) responses indicate a non–time-coherent performance, with the tweeter connected in inverse polarity to the woofer. The waterfall plot calculated from the impulse response (fig.9) shows a clean initial decay, but some low-level treble hash. There are also what look like residual woofer-cone breakup modes present in the low treble, which might correlate with the lispy quality noted on spoken voice and the slight mid-treble emphasis audible on pink noise.
Fig.6 Rogers Studio 3, vertical response family at 50", normalized to response on tweeter axis, from back to front: differences in response 15°–5° above tweeter axis; reference response; differences in response 5°–10° below tweeter axis.
The impulse (fig.7) and step (fig.8) responses indicate a non–time-coherent performance, with the tweeter connected in inverse polarity to the woofer. The waterfall plot calculated from the impulse response (fig.9) shows a clean initial decay, but some low-level treble hash. There are also what look like residual woofer-cone breakup modes present in the low treble, which might correlate with the lispy quality noted on spoken voice and the slight mid-treble emphasis audible on pink noise.
 Fig.7 Rogers Studio 3, impulse response on tweeter axis at 50" (5ms time window, 30kHz bandwidth).
 Fig.8 Rogers Studio 3, step response on tweeter axis at 50" (5ms time window, 30kHz bandwidth).
 Fig.9 Rogers Studio 3, cumulative spectral-decay plot at 50" (0.15ms risetime).
The cabinet appears to be as inert as the impedance plot indicated. The waterfall plot calculated from the output of an accelerometer fastened to the center of the Studio 3's side wall (fig.10) showed a small number of resonant modes, these well down in level compared with the LS3/5a. Checking with a stethoscope while the speaker was reproducing music confirmed this finding. The Studio 3's cabinet is better behaved than either of the Harbeths'.—John Atkinson
Fig.9 Rogers Studio 3, cumulative spectral-decay plot at 50" (0.15ms risetime).
The cabinet appears to be as inert as the impedance plot indicated. The waterfall plot calculated from the output of an accelerometer fastened to the center of the Studio 3's side wall (fig.10) showed a small number of resonant modes, these well down in level compared with the LS3/5a. Checking with a stethoscope while the speaker was reproducing music confirmed this finding. The Studio 3's cabinet is better behaved than either of the Harbeths'.—John Atkinson
 Fig.10 Rogers Studio 3, cumulative spectral-decay plot of accelerometer output fastened to center of cabinet sidewall (MLS driving voltage, 7.55V, 2kHz bandwidth).
Fig.1 Rogers Studio 3, electrical impedance (solid) and phase (dashed) (2 ohms/vertical div.).
Looking at the individual responses of the woofer and tweeter (fig.2) reveals a crossover set at 2.5kHz, with very steep acoustic slopes. The woofer is a mite peaky on-axis at the top of its passband, which correlates with the slight coloration noted. When its output is added to that of the tweeter in the overall response (fig.3), the result is exaggerated by the overlap between the drivers. Other than that, however, the response is commendably flat. The woofer tuning appears to be classically overdamped, gently rolling off below 150Hz without a hint of any upper-bass peak, reaching its –6dB point at 90Hz, half an octave higher than the Harbeth speakers. Remember, however, that unlike the other speakers, which are free-space designs, the Studio 3 is intended to be used close to the wall behind it, which will boost its in-room bass.
Fig.2 Rogers Studio 3, acoustic crossover on tweeter axis at 50", corrected for microphone response, with nearfield woofer response plotted below 300Hz.
Fig.3 Rogers Studio 3, anechoic response on tweeter axis at 50", averaged across 30° horizontal window and corrected for microphone response, with woofer responses plotted below 300Hz.
This can be seen from the spatially averaged in-room response taken with the Studio 3s in the same positions as the LS3/5a (fig.4). The entire bass region can be seen to be shelved down, with a slight rising trend through the midrange and treble. The Rogers's lateral dispersion (fig.5) is less even than the Harbeth HL-P3's, some peakiness developing off-axis in the mid-treble, with a trough in the upper midrange. The top octave is maintained to 15° off-axis but drops off rapidly at more extreme angles. In the vertical plane (fig.6), there is very little change in the response unless the listener moves below the woofer axis or more than 7.5° above the top of the cabinet. Stand height should therefore be less critical than with the other speakers reviewed.
Fig.4 Rogers Studio 3, spatially averaged 1/3-octave response in JA's listening room.
Fig.5 Rogers Studio 3, horizontal response family at 50", normalized to response on tweeter axis, from back to front: differences in response 90°–5° off-axis; reference response; differences in response 5°–90° off-axis.
Fig.6 Rogers Studio 3, vertical response family at 50", normalized to response on tweeter axis, from back to front: differences in response 15°–5° above tweeter axis; reference response; differences in response 5°–10° below tweeter axis.
The impulse (fig.7) and step (fig.8) responses indicate a non–time-coherent performance, with the tweeter connected in inverse polarity to the woofer. The waterfall plot calculated from the impulse response (fig.9) shows a clean initial decay, but some low-level treble hash. There are also what look like residual woofer-cone breakup modes present in the low treble, which might correlate with the lispy quality noted on spoken voice and the slight mid-treble emphasis audible on pink noise.
Fig.7 Rogers Studio 3, impulse response on tweeter axis at 50" (5ms time window, 30kHz bandwidth).
Fig.8 Rogers Studio 3, step response on tweeter axis at 50" (5ms time window, 30kHz bandwidth).
Fig.9 Rogers Studio 3, cumulative spectral-decay plot at 50" (0.15ms risetime).
The cabinet appears to be as inert as the impedance plot indicated. The waterfall plot calculated from the output of an accelerometer fastened to the center of the Studio 3's side wall (fig.10) showed a small number of resonant modes, these well down in level compared with the LS3/5a. Checking with a stethoscope while the speaker was reproducing music confirmed this finding. The Studio 3's cabinet is better behaved than either of the Harbeths'.—John Atkinson
Fig.10 Rogers Studio 3, cumulative spectral-decay plot of accelerometer output fastened to center of cabinet sidewall (MLS driving voltage, 7.55V, 2kHz bandwidth).