Sidebar 3: Measurements
I measured the Meitner MA3i Integrated with my Audio Precision SYS2722 system, repeating some tests with the magazine's higher-resolution APx555 system. I performed the testing using the AES3 and coaxial and TosLink S/PDIF inputs, all of which accepted data sampled at all rates up to 192kHz, as well as via the USB and network ports. Apple's AudioMIDI utility revealed that the MA3i's USB port accepted 16- and 24-bit integer data sampled at all rates from 44.1kHz to 384kHz. Apple's USB Prober app identified the Meitner as "MA-3i DAC with MQA Decoder" from "EMM Labs," and confirmed that the USB port operated in the optimal isochronous asynchronous mode. Roon recognized the Meitner as "Meitner MA3i" and confirmed that it would act as an MQA decoder and renderer.
The Meitner's analog outputs preserved absolute polarity (ie, were noninverting) from all of the MA3i's digital inputs. The balanced and unbalanced output impedances were identical, at a low 297 ohms from 20Hz to 20kHz. The volume control operated in accurate 0.5dB steps and with the control set to its maximum, the output level with full-scale 1kHz data was 6V from the balanced outputs and 3V from the single-ended outputs. These levels are 3.23dB higher than with the original MA3 Integrated that JVS reviewed in June 2022.
Like earlier processors designed by Ed Meitner, the MA3i uses two different reconstruction filters, an IIR (Infinite Impulse Response) filter and an FIR (Finite Impulse Response) filter. A detector looks at the nature of the audio signal and directs the digital audio data to the filter best suited for that type of signal. Musical components that are fairly continuous in level with no transients are routed to the FIR filter; signals with steep leading edges are sent to the IIR filter. The two filters' outputs are then combined and output to the DAC chips. The musical signal is therefore processed by the optimum filter type for each kind of signal.

Overall, Meitner's MA3i did superbly well on the test bench.—John Atkinson
Footnote 1: Though the Ayre can digitize signals at 192kHz, 96kHz is the highest rate Fuzzmeasure can accept. Footnote 2: This signal comprises data at –1 least significant bit (LSB), digital zero, and +1 LSB. In the twos-complement encoding used by 16-bit digital audio, –1 LSB is represented by 1111 1111 1111 1111, digital zero by 0000 0000 0000 0000, and +1 LSB by 0000 0000 0000 0001. If the undithered waveform is symmetrical, changing all 16 bits in the digital word gives exactly the same change in the analog output level as changing just the LSB.
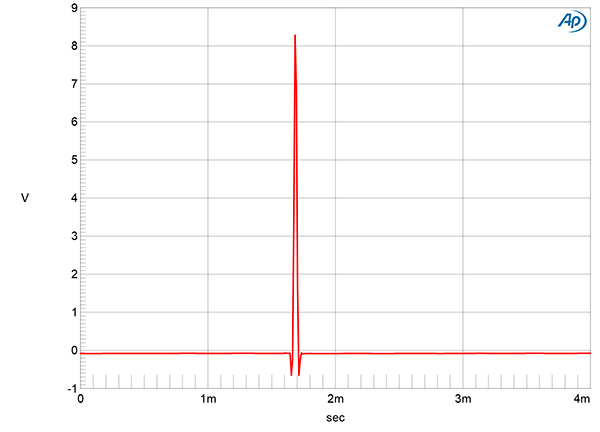
Fig.1 Meitner MA3i, impulse response (one sample at 0dBFS, 44.1kHz sampling, 4ms time window).
I test a processor's impulse response by sending it 44.1kHz PCM data representing a single full-scale sample via USB from my MacBook Pro. While this signal is "illegal," in that it could never be recorded—I created it by drawing the waveform with a digital audio workstation—when fed to a processor the resultant impulse response maps the coefficients of the reconstruction filter, thus identifying its type. I set the Audio Precision's A/D converter's sample rate to 200kHz so that its anti-aliasing filter's behavior won't affect the result. Fig.1 shows the MA3i's impulse response; it indicates that the reconstruction filter offers almost perfect time-domain behavior, with a single cycle of ringing on both sides of the single sample.
I thought about how to examine the impulse response of the Meitner's alternate filter. The Fuzzmeasure app I use to measure loudspeaker responses uses what's called a "chirp" signal—a sinewave that sweeps from 10Hz to 20kHz in 10 seconds—which won't have the very short risetime of the single full-scale sample. The app then performs an inverse Fourier transform on the recorded frequency response to calculate the impulse response. I therefore created a WAV file sampled at 44.1kHz of the chirp and fed the data from my MacBook Pro to the MA3i via USB. I captured the processor's analog output signal with an Ayre QA-9 A/D converter operating with a 96kHz sample rate (footnote 1) and sent the Ayre's digital output to the Fuzzmeasure app running on my Mac mini via USB.
Fig.2 Meitner MA3i, wideband spectrum of white noise at –4dBFS (left channel red, right magenta) and 19.1kHz tone at 0dBFS (left blue, right cyan) into 100k ohms with USB data sampled at 44.1kHz (20dB/vertical div.).
Well, best-laid plans and all that. Unless I set the QA-9's sample rate to 44.1kHz, Fuzzmeasure wasn't able to calculate the impulse response from the captured chirp data. And with the 44.1kHz sample rate all I ended up with was the impulse response of the Ayre's anti-aliasing filter. This suggests that the MA3i had selected the same time-perfect reconstruction filter with the chirp signal that it did with the single high sample. This was confirmed by FFT analysis, which showed the same slow rolloff above 10kHz with the chirp as I found with white noise sampled at 44.1kHz (fig.2, magenta and red traces). The noise spectrum doesn't reach full stop-band attenuation until 44.1kHz. However, the aliased image at 25kHz of a full-scale tone at 19.1kHz (cyan, blue) was suppressed by almost 120dB, which suggests that the alternate filter had been selected with this signal. Fig.2 indicates that the harmonics associated with the 19.1kHz tone are all very low in level.
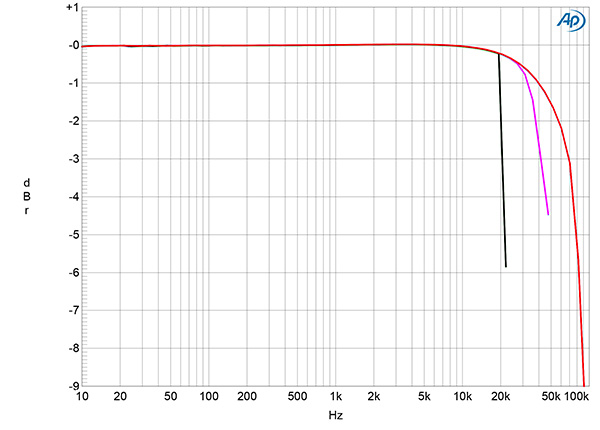
Fig.3 Meitner MA3i, frequency response at –12dBFS into 100k ohms with TosLink data sampled at: 44.1kHz (left channel green, right gray), 96kHz (left cyan, right magenta), and 192kHz (left blue, right red) (1dB/vertical div.).
Fig.3 shows the Meitner's frequency response with TosLink data sampled at 44.1, 96, and 192kHz. The responses at all three sample rates are flat in the audioband, which suggests that the alternate filter was being selected. The ultrasonic rolloff at the two higher rates follows the same basic shape before sharply rolling off at half of each rate. This graph was taken from the MA3i's balanced outputs with its volume control set to its maximum. I repeated the test from the unbalanced outputs and at lower volume-control settings; the results were identical.
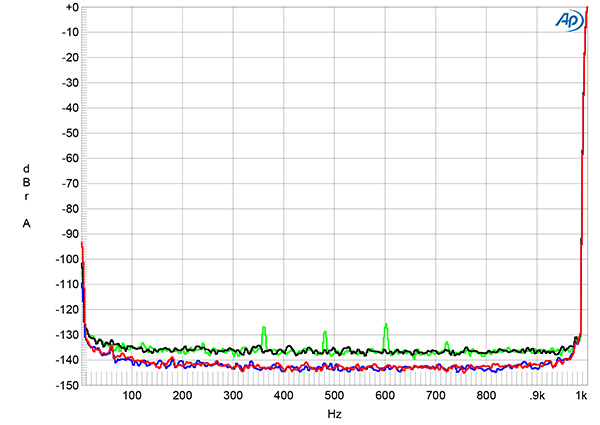
Fig.4 Meitner MA3i, balanced output, spectrum with noise and spuriae of dithered, 24-bit 1kHz tone at 0dBFS with volume control set to the maximum (left channel blue, right red) and with volume control set to –12dB (left green, right gray) (20dB/vertical div.).
Channel separation (not shown) was superb, at >120dB in both directions below 3kHz. It decreased to a still excellent 112dB at the top of the audioband. The low-frequency noisefloor (fig.4) was free from any power supply–related spuriae. The blue and red traces in this graph were taken with the volume control set to the maximum; lowering the volume by 12dB (green, gray traces) raised the noisefloor by around 6dB, but this is still a very low level. Interestingly, with "digital black" input data there was 32mV of ultrasonic noise present at the analog output, with a center frequency of 205kHz. Presumably this is due to the MA3i upsampling PCM data to DSD.
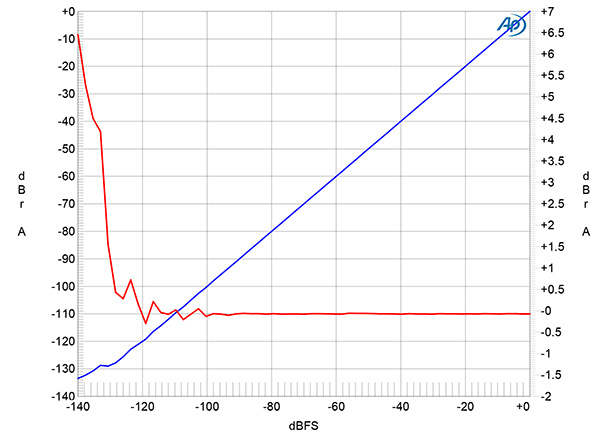
Fig.5 Meitner MA3i, left channel, 1kHz output level vs 24-bit data level in dBFS (blue, 20dB/vertical div.); linearity error (red, 1dB/small vertical div.).
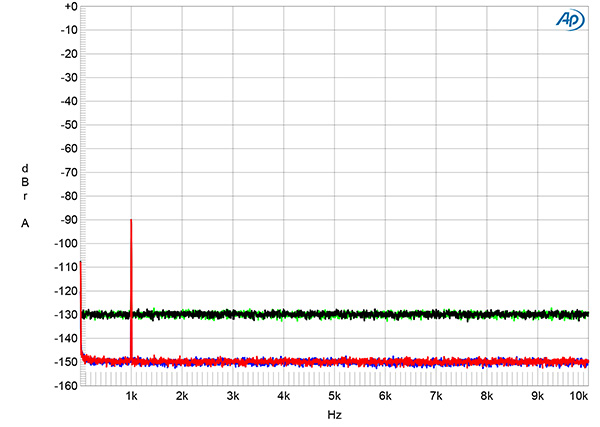
Fig.6 Meitner MA3i, spectrum with noise and spuriae of dithered 1kHz tone at –90dBFS with: 16-bit TosLink data (left channel cyan, right magenta), 24-bit TosLink data (left blue, right red) (20dB/vertical div.).
The red trace in fig.5 plots the error in the analog output level as a 24-bit, 1kHz digital tone drops from 0dBFS to –140dBFS. The amplitude error is negligible until the signal lies below –120dBFS, which implies high resolution. An increase in bit depth from 16 to 24 with dithered data representing a 1kHz tone at –90dBFS (fig.6) dropped the MA3i's noisefloor by 20dB, which suggests that the measured resolution lies between 19 and 20 bits.
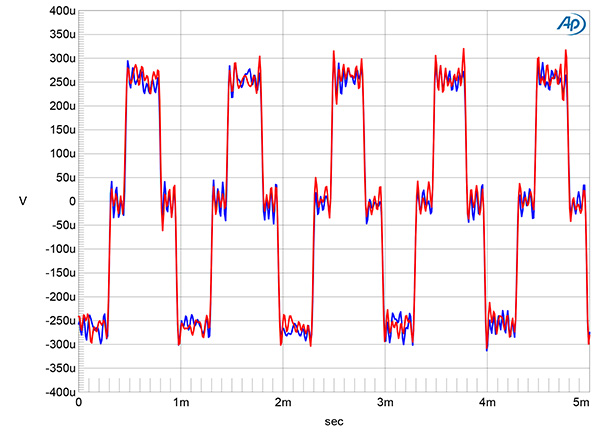
Fig.7 Meitner MA3i, waveform of undithered 1kHz sinewave at –90.31dBFS, 16-bit data (left channel blue, right red).
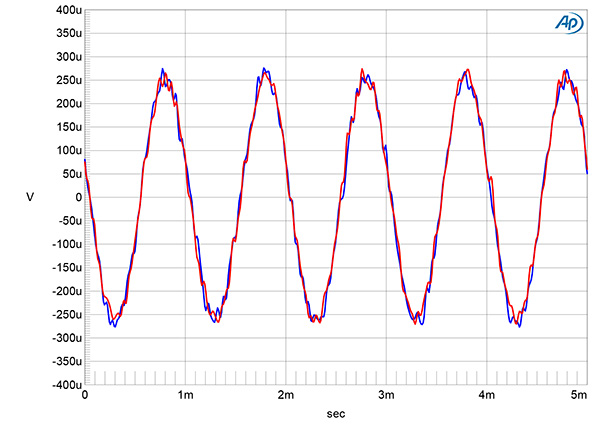
Fig.8 Meitner MA3i, waveform of undithered 1kHz sinewave at –90.31dBFS, 24-bit data (left channel blue, right red).
When I played undithered data representing a tone at exactly –90.31dBFS (footnote 2), the waveform was symmetrical and the three DC voltage levels were well-resolved (fig.7). Repeating the measurement with undithered 24-bit data gave a clean sinewave (fig.8).
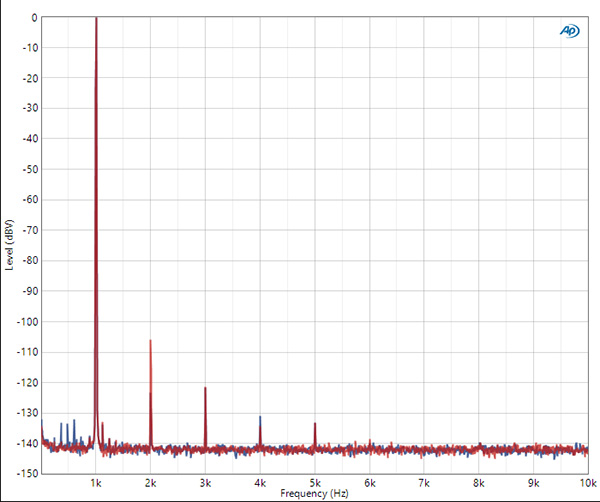
Fig.9 Meitner MA3i, balanced output, 24-bit TosLink data, spectrum of 1kHz sinewave, DC–1kHz, at 0dBFS into 100k ohms (left channel blue, right red; linear frequency scale).
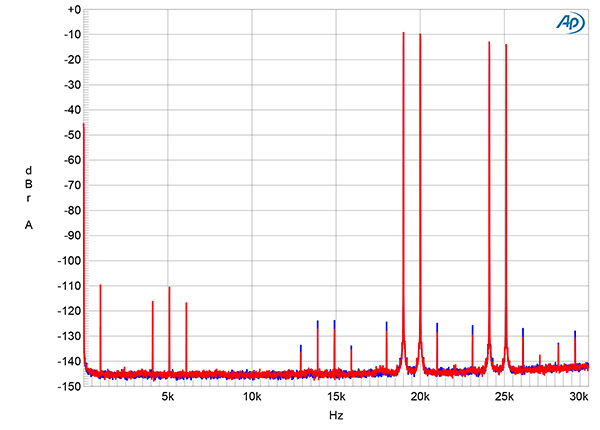
Fig.10 Meitner MA3i, balanced output, 24-bit TosLink data, HF intermodulation spectrum, DC–30kHz, 19+20kHz at 0dBFS into 600 ohms, 44.1kHz data (left channel blue, right red; linear frequency scale).
The MA3i produced very low levels of harmonic distortion. With a full-scale 1kHz tone, the second harmonic was the highest in level in the balanced right channel output at just –106dB (0.0005%, fig.9, red trace). The second harmonic was 20dB lower in level in the left channel's output (fig.9, blue trace). This spectrum was taken into the high 200k ohm load. Commendably, when I reduced the load impedance to 600 ohms, the levels of the harmonics didn't change. Intermodulation distortion with an equal mix of 19 and 20kHz tones, each lying at –6dBFS and sampled at 44.1kHz, was very low in level, even into 600 ohms (fig.10). Though aliased images of the primary tones are present in the audioband, these all lay close to –110dB. However, the aliased images at 24.1kHz and 25.1kHz are almost as high in level as the primary tones, which suggests that the time-perfect reconstruction filter was being used with this signal.
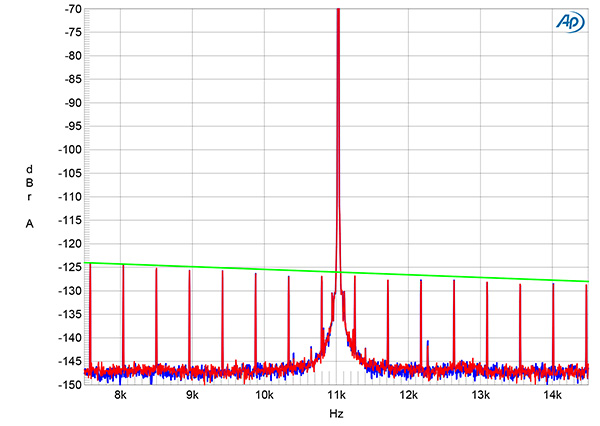
Fig.11 Meitner MA3i, high-resolution jitter spectrum of analog output signal, 11.025kHz at –6dBFS, sampled at 44.1kHz with LSB toggled at 229Hz: 16-bit TosLink data (left channel blue, right red). Center frequency of trace, 11.025kHz; frequency range, ±3.5kHz.
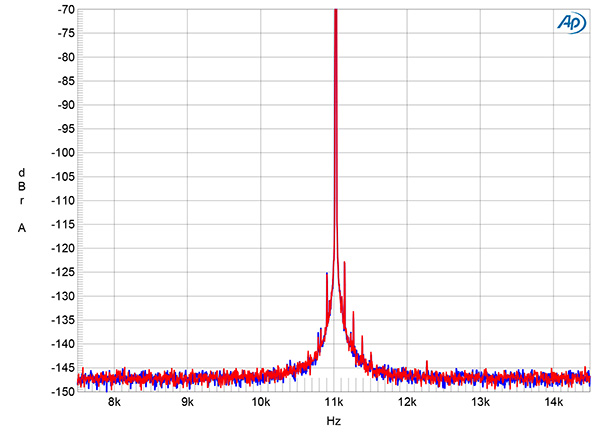
Fig.12 Meitner MA3i, high-resolution jitter spectrum of analog output signal, 11.025kHz at –6dBFS, sampled at 44.1kHz with LSB toggled at 229Hz: 24-bit TosLink data (left channel blue, right red). Center frequency of trace, 11.025kHz; frequency range, ±3.5kHz.
Fig.11 shows the spectrum of the MA3i's output when it was fed high-level, optical 16-bit J-Test data. The odd-order harmoncs of the undithered low-frequency, LSB-level squarewave all lie at the correct levels, indicated by the sloping green line. Repeating the analysis with 24-bit J-Test data resulted in a clean spectrum (fig.12). The 16- and 24-bit jitter spectra were identical with USB and network data, other than the appearance of a pair of sidebands at ±120Hz on either side of the spectral spike that represents the high-level 11.025kHz tone.
Footnote 1: Though the Ayre can digitize signals at 192kHz, 96kHz is the highest rate Fuzzmeasure can accept. Footnote 2: This signal comprises data at –1 least significant bit (LSB), digital zero, and +1 LSB. In the twos-complement encoding used by 16-bit digital audio, –1 LSB is represented by 1111 1111 1111 1111, digital zero by 0000 0000 0000 0000, and +1 LSB by 0000 0000 0000 0001. If the undithered waveform is symmetrical, changing all 16 bits in the digital word gives exactly the same change in the analog output level as changing just the LSB.