Robert Harley generated the test-bench measurements and provided me with the data after I finished my listening tests. The Mark Levinson No.36 has an output of 1.85V (left) and 1.84V (right), unbalanced (3.69V, L&R, balanced) when decoding a 1kHz, 0dBFS (full-scale) sinewave. Its output impedance measured 7 ohms unbalanced, 13.4 ohms balanced—this processor should be able to drive any commercial preamplifier and cable with no adverse effects. The No.36 was non-inverting in its unbalanced mode, with pin 2 positive in the balanced mode. Its DC offset was 0.2mV in the left channel, 0mv in the right, unbalanced (balanced: 0.2mV left, 0.1mV right).
The remaining measurements were taken from the balanced outputs, unless otherwise noted:
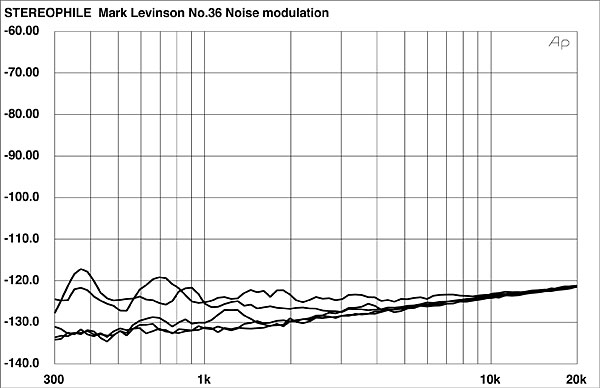
The No.36's frequency response was very flat (fig.1). The top curves indicate the normal frequency response, the bottom the de-emphasis error. The latter would only matter on only a small percentage of discs; most don't use pre-emphasis. Nevertheless, the No.36 will play such pre-emphasized discs with vanishingly small response deviation. The Levinson's crosstalk (not shown) is outstandingly low—so low, in fact, that at better than –120dB across the band, it is of little more than academic interest.
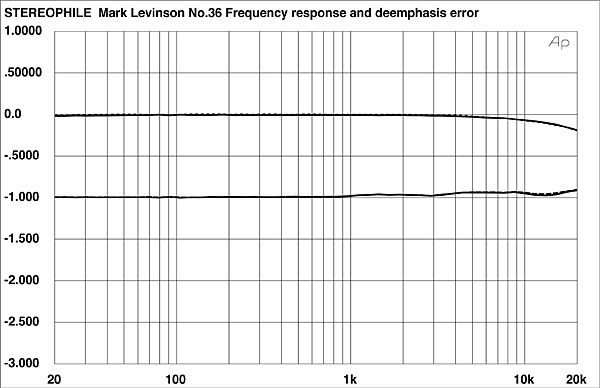
Fig.2 shows a decoded –90dB, 1kHz dithered sinewave signal. The only artifacts worth noting here are at 120Hz and 240Hz—clearly power-supply noise. But they are below –120dB! Using the same type of spectral analysis,
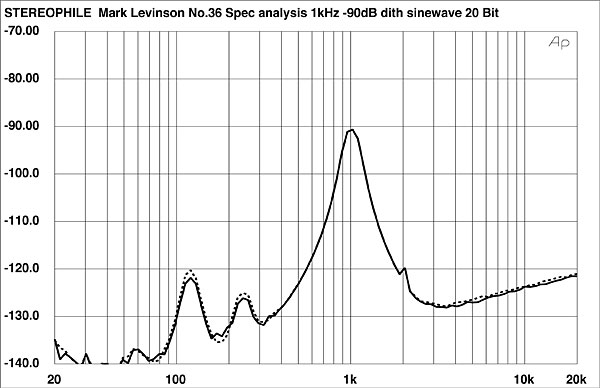
Fig.3 shows the result of the Mark Levinson decoding a track of "digital silence" (all data words zero) out to 200kHz, with first-rate results. Again, the very-low-level power-supply noise is visible—and little else.
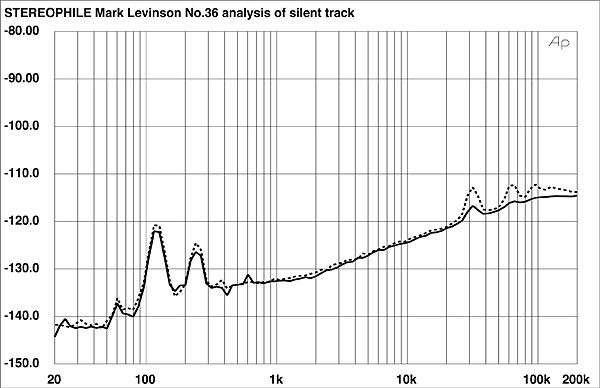
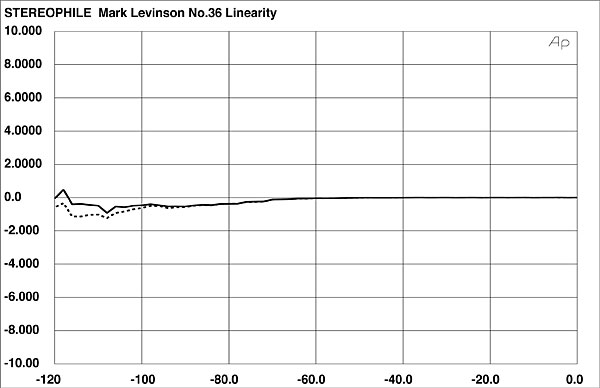
Fig.4 shows the fade-to-noise with dither, indicating superb linearity down to the measurement limit at –120dB. In fact, while we've measured D/A converters with slightly less linearity error at –80 and –100dB (the No.36 is off by an inconsequential 0.5dB or so at those points), I have not seen another D/A converter with so little error at –120dB.
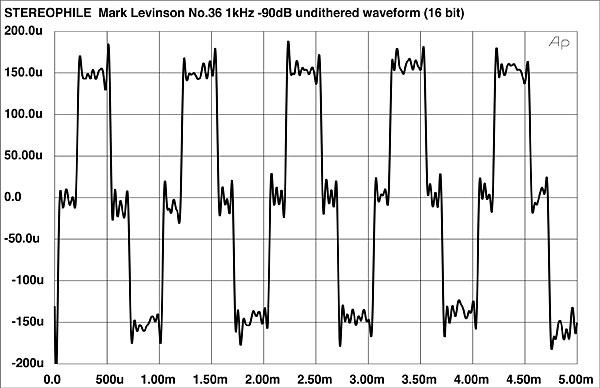
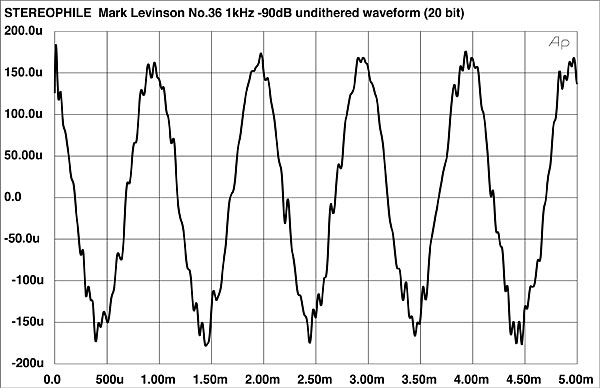
The plots in figs.5 and 6 show the results of the Mark Levinson decoding a 1kHz, undithered sinewave at –90dB, with 16-bit and 20-bit resolution, respectively. Both results are superb in both waveshape and absence of noise, with the classic step-appearance of the 16-bit result clearly evident, as it should be.
Noise modulation as a function of signal level vs frequency is plotted in fig.7. The results shown here are for six different, progressively lower signal levels decreasing from –50dB to –100dB. In theory, the more tightly clustered the results, the better. The clustering here is relatively poor as high-end D/A converters go; yet the overall levels indicated are generally 10dB or more lower than those in the converters we've tested that have performed best on this measurement. Should the No.36 be criticized because it demonstrates dramatically lower noise, at the expense of the best clustering on this test? I think not. In any event, I tend to be conservative in attempting to relate the result of this test to a converter's audible performance. Below a certain threshold—a threshold I suspect is well above the result here—that relationship may well disappear.
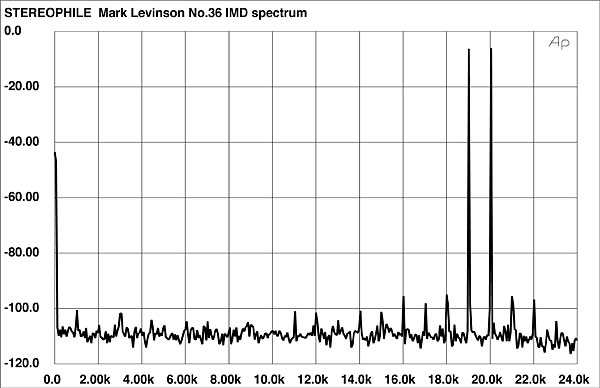
Feeding a full-scale combined 19kHz+20kHz signal into the No.36 and performing an FFT analysis of the output results in the plot in fig.8: the artifacts are very low, comparable to the best we've measured.
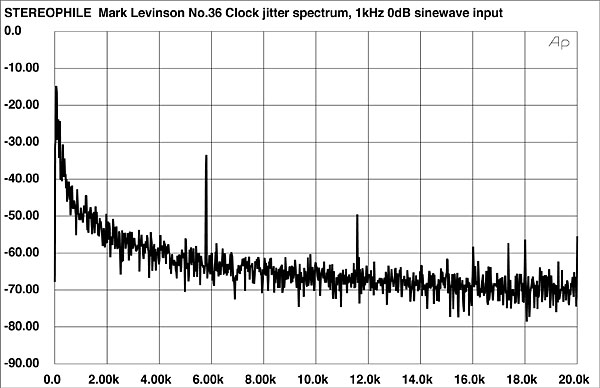
The FFT of the Meitner LIM Detector output, an assessment of the No.36's jitter performance, is shown in fig.9. I've shown only the result with a 1kHz, 0dBFS sinewave input; the results with a –90dB, 1kHz sinewave, and with an all-zero input, were essentially identical, except that the spikes at 16kHz and 18kHz disappear into the noise. This is a very clean result. The major jitter component is just under 6kHz. I suspect that the audible result of this—and of the other isolated artifacts indicated—is nil. At least, I'd be unwilling to draw any conclusions unless I could hear an otherwise identical D/A converter exhibiting no artifacts at all—an unlikely circumstance. The RMS jitter of the No.36 measured 50 picoseconds and was independent of signal level. While this is higher than the specified 20ps, it is nevertheless one of the best results we've measured.
The measured performance of the No.36 is superb, consistent in every way with the listening tests.—Thomas J. Norton