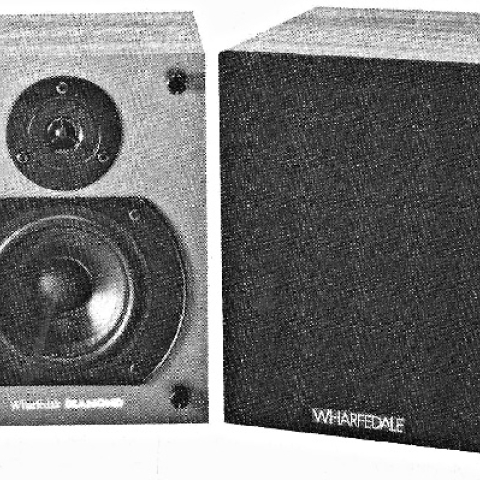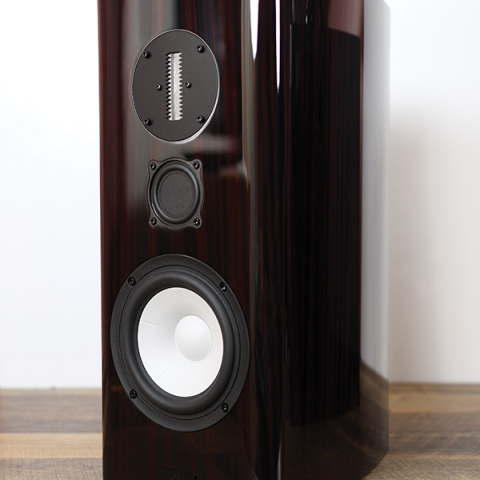
Sidebar 3: Measurements The Tukan's measured sensitivity of 86.5dB will make it a bit easier to drive than the Aerial 5. This sensitivity is 2dB higher than the 5's—a difference roughly equivalent to that between 45Wpc and 70Wpc amplifiers. The impedance minimum (fig.1) is a not-too-cruel 4.6 ohms, with most of the band keeping above 6 ohms. The port tuning at 57Hz is accompanied by a dip in the impedance curve. The slight wrinkle in the curve at 28kHz is due to the ultrasonic tweeter resonance.  Fig.1 Linn Tukan, electrical impedance (solid) and phase (dashed) (2 ohms/vertical div.). The individual driver and port responses (fig.2) show that the port is overdamped, which provides better bass definition at the expense of extension. The port also produces some low-level spuriae. The early bass rolloff is accompanied by a general rise in the woofer's output at the top of its passband.
 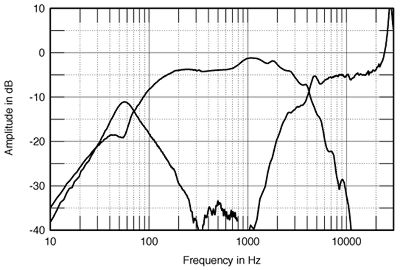 Fig.2 Linn Tukan, acoustic crossover on tweeter axis at 50", corrected for microphone response, with nearfield woofer and port responses plotted below 300Hz.
Looking next at the Tukan's response averaged over a 30 degrees lateral window (fig.3), we can see the source of my impressions of a lively and immediate sound. The general rise in response between 800Hz and 4kHz will give the Tukans a greater sense of clarity, forwardness, and presence. The wide bandwidth of this peak should add immediacy without adding "nasal" or "cupped-hands" colorations. This is exactly the band in which the ear is most sensitive to both low-level sounds and small changes in amplitude. This is perhaps why I felt the Tukans "came alive" at low listening levels. Fig.3 also shows the early bass rolloff (it starts tilting down at 150Hz), and a very flat if shelved-down treble response in the top two octaves.
Fig.2 Linn Tukan, acoustic crossover on tweeter axis at 50", corrected for microphone response, with nearfield woofer and port responses plotted below 300Hz.
Looking next at the Tukan's response averaged over a 30 degrees lateral window (fig.3), we can see the source of my impressions of a lively and immediate sound. The general rise in response between 800Hz and 4kHz will give the Tukans a greater sense of clarity, forwardness, and presence. The wide bandwidth of this peak should add immediacy without adding "nasal" or "cupped-hands" colorations. This is exactly the band in which the ear is most sensitive to both low-level sounds and small changes in amplitude. This is perhaps why I felt the Tukans "came alive" at low listening levels. Fig.3 also shows the early bass rolloff (it starts tilting down at 150Hz), and a very flat if shelved-down treble response in the top two octaves. 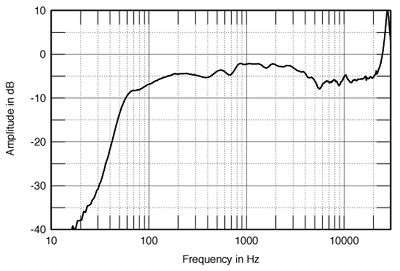 Fig.3 Linn Tukan, anechoic response on tweeter axis at 50", averaged across 30 degrees horizontal window and corrected for microphone response, with complex sum of nearfield woofer and port responses plotted below 300Hz. Fig.4 shows the manner in which the Tukan's response changes as a function of listening height normalized to the tweeter axis. Perhaps an intentional design goal for a "bookshelf" loudspeaker, the dispersion remains fairly constant below the tweeter axis. I found this when putting the Tukans on a high bookshelf and sitting well below the tweeters. Above the tweeter axis, however, a large suckout appears at the crossover frequency. In other words, sitting too low is better than sitting too high. The optimal height was with my ears 5 degrees below the tweeter axis.
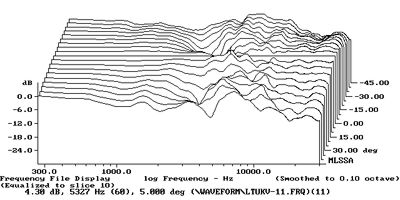 Fig.4 Linn Tukan, vertical response family at 50", normalized to response on tweeter axis, from back to front: differences in response 45 degrees-5 degrees above tweeter axis; reference response; differences in response 5 degrees-45 degrees below tweeter axis. The Tukan also had good lateral off-axis behavior (fig.5), its dispersion smooth and well-controlled, with no large response anomalies. This reduces coloration of sidewall reflections, and corresponds with the excellent imaging I heard from the Tukans.
 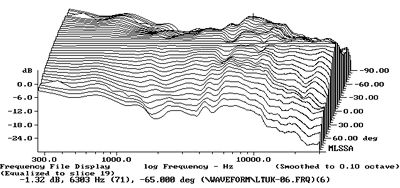 Fig.5 Linn Tukan, horizontal response family at 50", normalized to response on tweeter axis, from back to front: differences in response 90 degrees-5 degrees off-axis; reference response; differences in response 5 degrees-90 degrees off-axis.
Fig.6, the Tukan's step response, reveals that the Tukan isn't time-coherent, but that the two drivers are wired with the same polarity. The waterfall plot (fig.7) shows a very clean decay and very little stored energy. This is an excellent-looking waterfall plot.
Fig.5 Linn Tukan, horizontal response family at 50", normalized to response on tweeter axis, from back to front: differences in response 90 degrees-5 degrees off-axis; reference response; differences in response 5 degrees-90 degrees off-axis.
Fig.6, the Tukan's step response, reveals that the Tukan isn't time-coherent, but that the two drivers are wired with the same polarity. The waterfall plot (fig.7) shows a very clean decay and very little stored energy. This is an excellent-looking waterfall plot.  Fig.6 Linn Tukan, step response on tweeter axis at 50" (5ms time window, 30kHz bandwidth).
 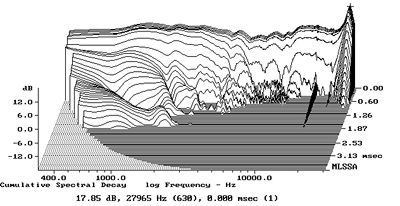 Fig.7 Linn Tukan, cumulative spectral-decay plot at 50" (0.15ms risetime). Using an accelerometer to measure the Tukan's cabinet resonance, it was apparent that the Linn's enclosure had some strong resonance modes. The back panel had a strong peak at 440Hz (fig.8) that might color the midrange; however, it is probably high enough in frequency to keep out of the way of the music.
  Fig.8 Linn Tukan, cumulative spectral-decay plot of accelerometer output fastened to rear panel above terminals. (MLS driving voltage to speaker, 7.55V; measurement bandwidth, 2kHz.)
The Tukan had good measured performance overall, but did exhibit some departures from the ideal. The defining characteristic of these measurements is the overall rise in midrange response seen in fig.3, which had the largest influence on the Tukan's overall sound.—Robert Harley
Fig.8 Linn Tukan, cumulative spectral-decay plot of accelerometer output fastened to rear panel above terminals. (MLS driving voltage to speaker, 7.55V; measurement bandwidth, 2kHz.)
The Tukan had good measured performance overall, but did exhibit some departures from the ideal. The defining characteristic of these measurements is the overall rise in midrange response seen in fig.3, which had the largest influence on the Tukan's overall sound.—Robert Harley
Fig.1 Linn Tukan, electrical impedance (solid) and phase (dashed) (2 ohms/vertical div.). The individual driver and port responses (fig.2) show that the port is overdamped, which provides better bass definition at the expense of extension. The port also produces some low-level spuriae. The early bass rolloff is accompanied by a general rise in the woofer's output at the top of its passband. Fig.2 Linn Tukan, acoustic crossover on tweeter axis at 50", corrected for microphone response, with nearfield woofer and port responses plotted below 300Hz. Fig.3 Linn Tukan, anechoic response on tweeter axis at 50", averaged across 30 degrees horizontal window and corrected for microphone response, with complex sum of nearfield woofer and port responses plotted below 300Hz. Fig.4 shows the manner in which the Tukan's response changes as a function of listening height normalized to the tweeter axis. Perhaps an intentional design goal for a "bookshelf" loudspeaker, the dispersion remains fairly constant below the tweeter axis. I found this when putting the Tukans on a high bookshelf and sitting well below the tweeters. Above the tweeter axis, however, a large suckout appears at the crossover frequency. In other words, sitting too low is better than sitting too high. The optimal height was with my ears 5 degrees below the tweeter axis. Fig.4 Linn Tukan, vertical response family at 50", normalized to response on tweeter axis, from back to front: differences in response 45 degrees-5 degrees above tweeter axis; reference response; differences in response 5 degrees-45 degrees below tweeter axis. The Tukan also had good lateral off-axis behavior (fig.5), its dispersion smooth and well-controlled, with no large response anomalies. This reduces coloration of sidewall reflections, and corresponds with the excellent imaging I heard from the Tukans. Fig.5 Linn Tukan, horizontal response family at 50", normalized to response on tweeter axis, from back to front: differences in response 90 degrees-5 degrees off-axis; reference response; differences in response 5 degrees-90 degrees off-axis. Fig.6 Linn Tukan, step response on tweeter axis at 50" (5ms time window, 30kHz bandwidth). Fig.7 Linn Tukan, cumulative spectral-decay plot at 50" (0.15ms risetime). Using an accelerometer to measure the Tukan's cabinet resonance, it was apparent that the Linn's enclosure had some strong resonance modes. The back panel had a strong peak at 440Hz (fig.8) that might color the midrange; however, it is probably high enough in frequency to keep out of the way of the music. Fig.8 Linn Tukan, cumulative spectral-decay plot of accelerometer output fastened to rear panel above terminals. (MLS driving voltage to speaker, 7.55V; measurement bandwidth, 2kHz.)