Sidebar 3: Measurements
Before doing any listening, I measured the May with my Audio Precision SYS2722 system (see the January 2008 "As We See It"). Apple's USB Prober utility identified the May as "Holo Audio UAC2.0 Gen2 Enhanced" from "Holo Audio." The USB port operated in the optimal isochronous asynchronous mode, and Apple's AudioMIDI utility revealed that, via that input, the May accepted 24-bit integer data sampled at all rates from 44.1kHz to an extraordinary 1536kHz. The AES/EBU and S/PDIF inputs, including Toslink optical, accepted data sampled at rates up to 192kHz.
The May's maximum output level at 1kHz in NOS, OS, and OS/PCM modes was 5.8V from the balanced outputs, 2.9V from the unbalanced outputs. The maximum output levels in OS/DSD mode were half the levels in the other modes, ie, 6dB lower. Both sets of outputs preserved absolute polarity (ie, were noninverting) in all four modes. The balanced output impedance was a low 27.5 ohms at all audio frequencies; the unbalanced output impedance was half that magnitude, as expected.
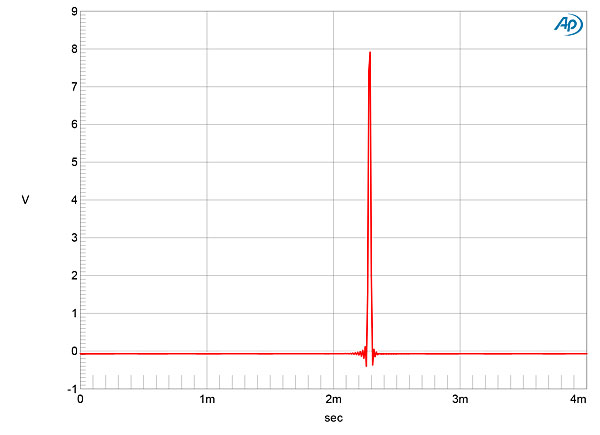
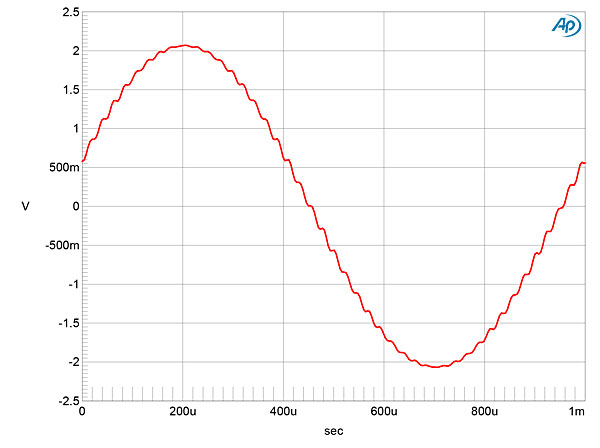
All the following measurements were taken from the balanced outputs. (I didn't find any differences with the single-ended outputs.) Fig.1 shows the May's impulse response with 44.1kHz data in NOS mode. Ignore the very small amount of symmetrical ringing before and after the single full-scale sample, which is due to the antialiasing filter of Audio Precision's A/D converter operating at a sample rate of 200kHz. This graph indicates perfect time-domain behavior due to the absence of a low-pass reconstruction filter. However, without such a filter, the DAC's output consists of the unsmoothed voltages represented by each digital word. The DAC's sample-and-hold mechanism results in a "stair-step" waveform (fig.2).
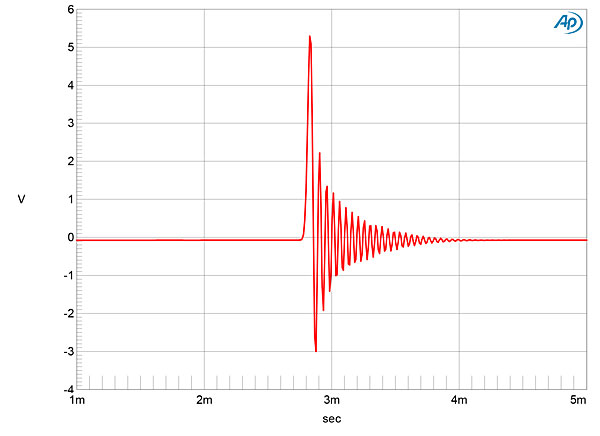
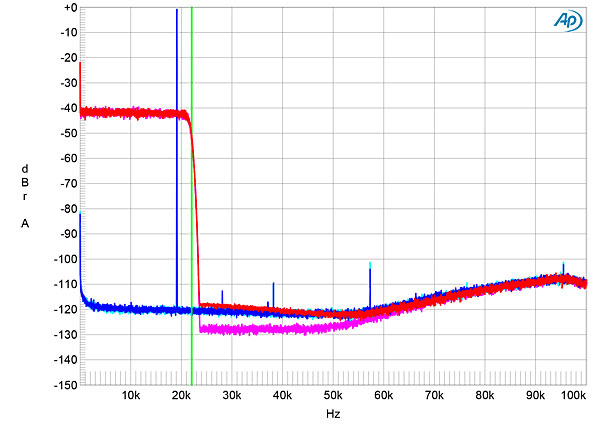
 Looking at the May's impulse response with 44.1kHz data and the OS, OS/PCM, and OS/DSD modes revealed that these three modes feature an identical reconstruction filter with a minimum-phase character (fig.4), with all the ringing following the single sample at 0dBFS. This filter's ultrasonic rolloff (fig.5, magenta and red traces) reaches full stop-band attenuation at 24kHz with complete suppression of the aliased image at 25kHz of a full-scale tone at 19.1kHz (cyan, blue). The harmonics associated with the 19.1kHz tone all lie below –104dB. The only difference between the OS and OS/PCM modes and OS/DSD mode is that the latter's spectrum has a gently rising noise floor above 55kHz (fig.6).
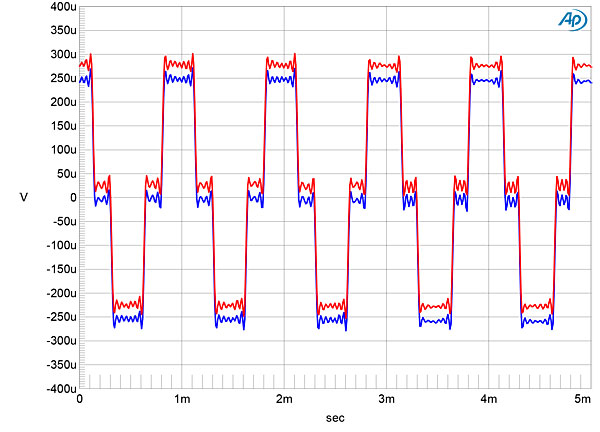
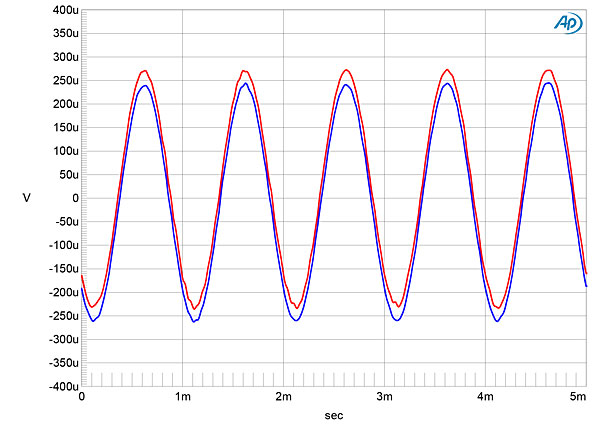
 When I played undithered 16-bit data representing a tone at exactly –90.31dBFS, the HoloAudio's waveform was symmetrical, with negligible DC offset, and the three DC voltage levels described by the data were free from noise (fig.13). With undithered 24-bit data, the May's very low analog noise floor means it can output a perfect sinewave, even at this very low signal level (fig.14).
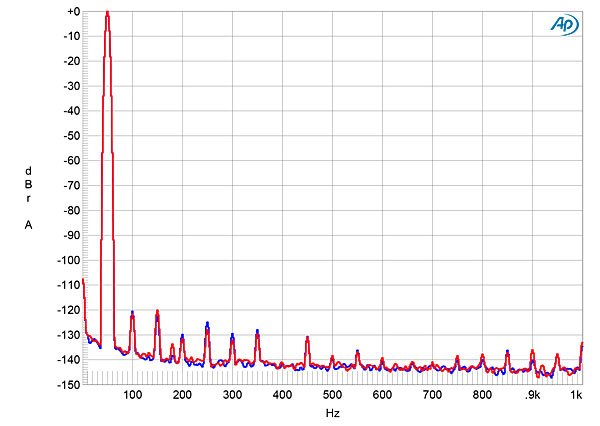
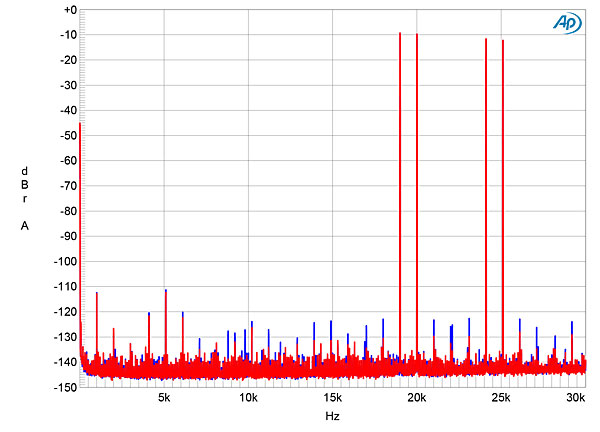
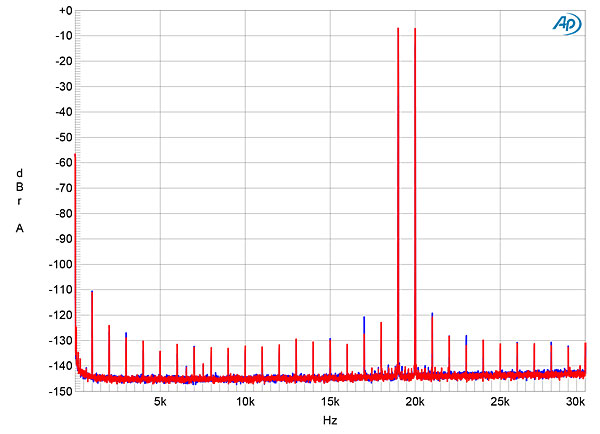
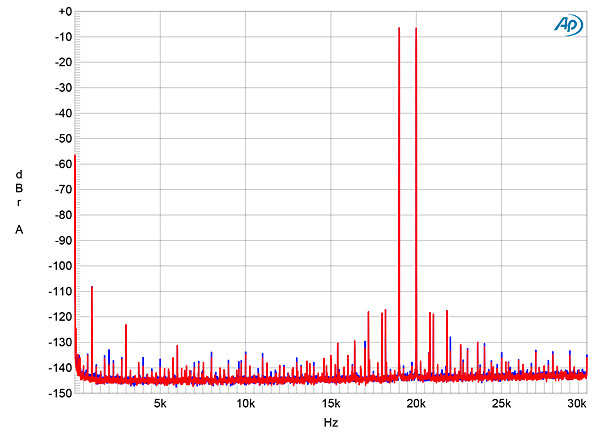
 As implied by the blue and cyan traces in fig.4, the May produced very low levels of harmonic distortion with full-scale data, even into the punishing 600 ohm load (fig.15). The second and third harmonics were the highest in level, but each lay at a negligible –120dB (0.0001%). Intermodulation distortion with an equal mix of 19kHz and 20kHz tones at –6dBFS sampled at 44.1kHz was very low (fig.16), with the difference tone at 1kHz lying at –114dB (0.0002%). This graph was taken in NOS mode, and the aliased images of the two tones at 24.1kHz and 25.1kHz are almost as high in level as the fundamentals. (Note that levels of the latter are closer to –9dB rather than the correct –6dB; see fig.7.) Repeating the test with data sampled at 96kHz (fig.17) moved the aliased products to much higher frequencies but revealed the presence of very–low-level intermodulation products. With 44.1kHz data and OS mode, the aliased images are absent (fig.18), but the noise floor is not as clean as I anticipated.
Footnote 1: See my discussion of how reconstruction filters work here.
Fig.1 HoloAudio May, NOS mode, impulse response (one sample at 0dBFS, 44.1kHz sampling, 4ms time window).
Fig.2 HoloAudio May, NOS mode, waveform of 1kHz sinewave at 0dBFS, 16-bit data.
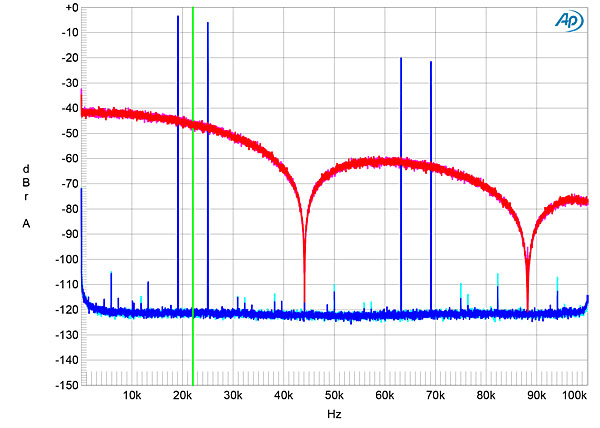
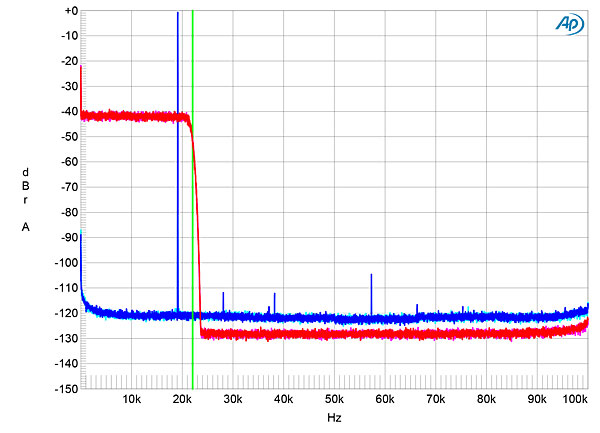
In the frequency domain, the absence of a reconstruction filter means that the spectrum of the audioband signal is mirrored on either side of each integer multiple of the original sample rate (footnote 1). This is graphically illustrated in fig.3, which shows the spectra of white noise and a 19.1kHz tone, both sampled at 44.1kHz and plotted up to 100kHz. The mirroring of the baseband spectra results in nulls at 44.1kHz and 88.2kHz, and there is only a gentle ultrasonic rolloff.
Fig.3 HoloAudio May, NOS mode, wideband spectrum of white noise at –4dBFS (left channel red, right magenta) and 19.1kHz tone at 0dBFS (left blue, right cyan) into 100k ohms with data sampled at 44.1kHz (20dB/vertical div.).
Fig.4 HoloAudio May, OS mode, impulse response (one sample at 0dBFS, 44.1kHz sampling, 4ms time window).
Fig.5 HoloAudio May, OS mode, wideband spectrum of white noise at –4dBFS (left channel red, right magenta) and 19.1kHz tone at 0dBFS (left blue, right cyan) into 100k ohms with data sampled at 44.1kHz (20dB/vertical div.).
Fig.6 HoloAudio May, OS/DSD mode, wideband spectrum of white noise at –4dBFS (left channel red, right magenta) and 19.1kHz tone at 0dBFS (left blue, right cyan) into 100k ohms with data sampled at 44.1kHz (20dB/vertical div.).
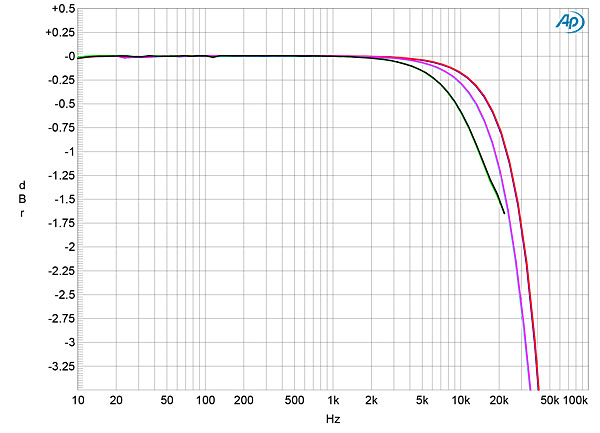
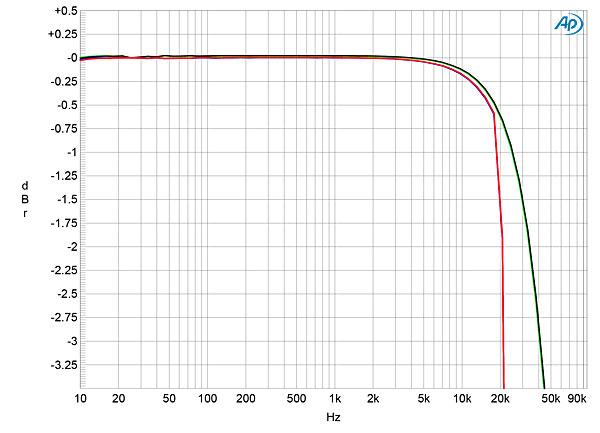
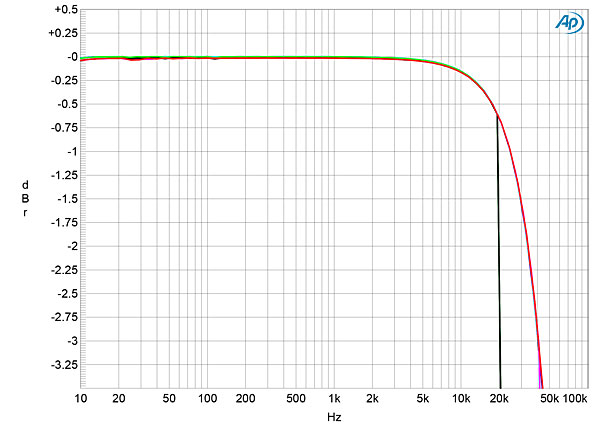
Fig.7 shows the May's frequency response in NOS mode with data sampled at 44.1, 96, and 192kHz. All three responses start rolling off in the top two audio octaves. With 44.1kHz data (green and gray data), the rolloff reaches –1.5dB at the top of the audioband, but the measured level is adulterated with aliased image energy. The actual rolloff is probably closer to –3dB at 20kHz (see fig.16). The response at the higher sample rates is down by 1dB at 19kHz (96kHz data, cyan and magenta traces) and 22kHz (192kHz data, blue and red traces). The response with 44.1kHz data in OS and OS/PCM modes (fig.8, green and gray traces) is –0.65dB at 20kHz, with then a sharp rolloff. With data at the higher sample rates, the response features a relatively gentle ultrasonic rolloff, but the 192kHz response (blue and red traces) doesn't extend significantly higher in frequency than that with 96kHz data (cyan and magenta traces). Even with 192kHz PCM data, the May's response in OS/DSD mode (fig.9, blue and red traces) rolled off sharply above 20kHz.
Fig.7 HoloAudio May, NOS mode, frequency response at –12dBFS into 100k ohms with data sampled at: 44.1kHz (left channel green, right gray), 96kHz (left cyan, right magenta), and 192kHz (left blue, right red) (0.5dB/vertical div.).
Fig.8 HoloAudio May, OS mode, frequency response at –12dBFS into 100k ohms with data sampled at: 44.1kHz (left channel green, right gray), 96kHz (left cyan, right magenta), and 192kHz (left blue, right red) (0.5dB/vertical div.).
Fig.9 HoloAudio May, frequency response at –12dBFS into 100k ohms with data sampled at 192kHz in OS mode (left green, right gray) and in DSD mode (left blue, right red) (0.5dB/vertical div.).
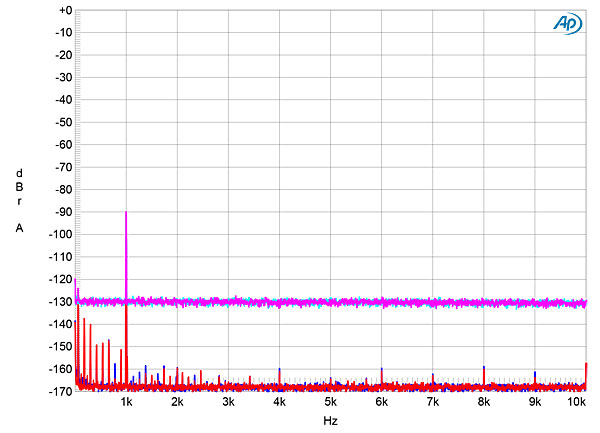
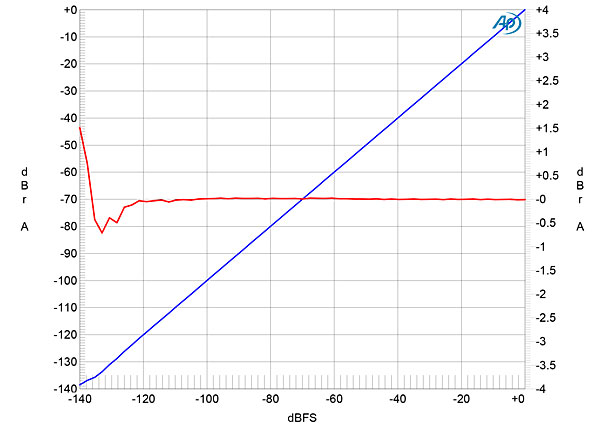
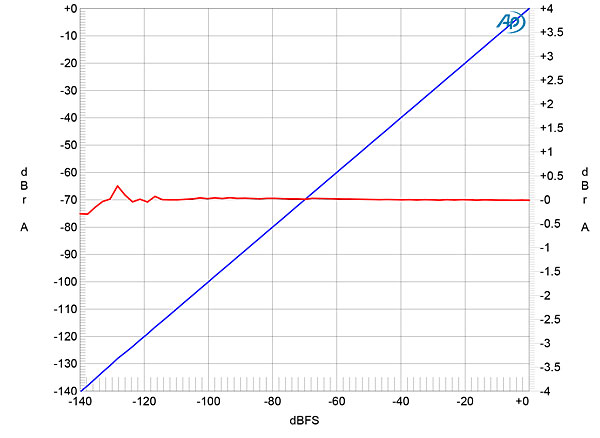
Channel separation was superb, at >122dB in both directions below 3kHz, decreasing to a still superb 115dB at 20kHz. An increase in bit depth from 16 to 24, with dithered data representing a 1kHz tone at –90dBFS, dropped the May's noise floor by 38dB (fig.10). This implies a resolution of more than 22 bits, which is the highest I have encountered, even exceeding that of the 21-bit resolution Weiss DAC502 that I reviewed in the August issue, and implying superbly low linearity error. The red trace in fig.11 shows the error in NOS mode as a 24-bit 1kHz tone swept down from 0dBFS to –140dBFS; it is negligible to below –120dBFS. For reference, fig.12 shows the same test result for the Weiss DAC502, which features even lower linearity error.
Fig.10 HoloAudio May, spectrum with noise and spuriae of dithered 1kHz tone at –90dBFS with: 16-bit data (left channel cyan, right magenta), 24-bit data (left blue, right red) (20dB/vertical div.).
Fig.11 HoloAudio May, left channel, 1kHz output level vs data level in dBFS (blue, 20dB/vertical div.); linearity error (red, 0.1dB/small vertical div.).
Fig.12 Weiss DAC502, left channel, 1kHz output level vs data level in dBFS (blue, 20dB/vertical div.); linearity error (red, 0.1dB/small vertical div.).
Fig.13 HoloAudio May, waveform of undithered 1kHz sinewave at –90.31dBFS, 16-bit data (left channel blue, right red).
Fig.14 HoloAudio May, waveform of undithered 1kHz sinewave at –90.31dBFS, 24-bit data (left channel blue, right red).
Fig.15 HoloAudio May, 24-bit data, spectrum of 50Hz sinewave, DC–1kHz, at 0dBFS into 600 ohms (left channel blue, right red; linear frequency scale).
Fig.16 HoloAudio May, NOS mode, 24-bit data, HF intermodulation spectrum, DC–30kHz, 19+20kHz at 0dBFS into 100k ohms, 44.1kHz data (left channel blue, right red; linear frequency scale).
Fig.17 HoloAudio May, NOS mode, 24-bit data, HF intermodulation spectrum, DC–30kHz, 19+20kHz at 0dBFS into 100k ohms, 96kHz data (left channel blue, right red; linear frequency scale).
Fig.18 HoloAudio May, OS mode, 24-bit data, HF intermodulation spectrum, DC–30kHz, 19+20kHz at 0dBFS into 100k ohms, 44.1kHz data (left channel blue, right red; linear frequency scale).
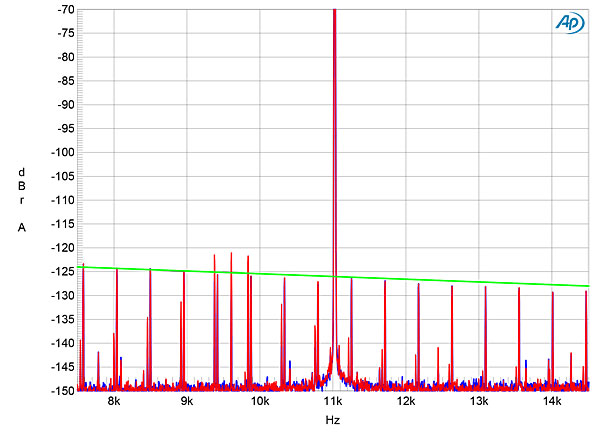
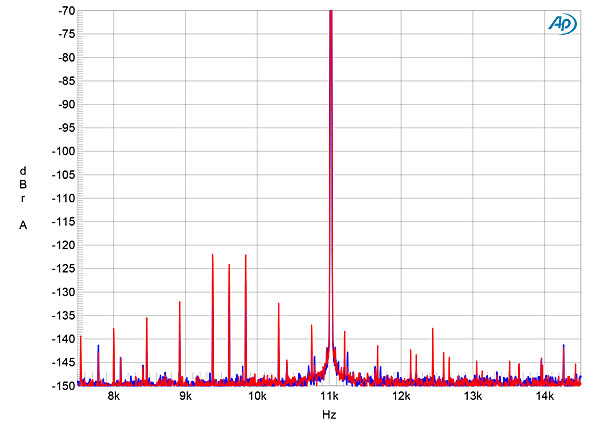
The HoloAudio processor offered excellent rejection of word-clock jitter. Fig.19 shows the spectrum of the May's output when it was fed high-level 16-bit J-Test data via AES/EBU. All the odd-order harmonics of the undithered low-frequency, LSB-level squarewave lie at the correct levels, and the central spike that represents the high-level tone at one-quarter the sample rate (Fs/4) is narrow. Though a trio of spurious tones is present between 9kHz and 10kHz, these are low in level. These tones were still present when I repeated this test with 24-bit data (fig.20).
Fig.19 HoloAudio May, high-resolution jitter spectrum of analog output signal, 11.025kHz at –6dBFS, sampled at 44.1kHz with LSB toggled at 229Hz: 16-bit AES/EBU data (left channel blue, right red). Center frequency of trace, 11.025kHz; frequency range, ±3.5kHz.
Fig.20 HoloAudio May, high-resolution jitter spectrum of analog output signal, 11.025kHz at –6dBFS, sampled at 44.1kHz with LSB toggled at 229Hz: 24-bit AES/EBU data (left channel blue, right red). Center frequency of trace, 11.025kHz; frequency range, ±3.5kHz.
In almost every way, the HoloAudio May (Level 3) is the best-measuring D/A processor I have encountered, rivaled only by the Weiss DAC502 and MBL N31.—John Atkinson
Footnote 1: See my discussion of how reconstruction filters work here.


