Sidebar 3: Measurements
I used DRA Labs' MLSSA system with a calibrated DPA 4006 microphone to measure the Harbeth Super HL5plus XD's behavior in the farfield and an Earthworks QTC-40 mike for the nearfield responses. I measured the speaker without the aluminum-frame grille and performed the primary response measurements on the super-tweeter axis. I measured the speaker's impedance magnitude and phase with Dayton Audio's DATS V2 system, but for consistency with Stereophile's presentation of impedance graphs, I plotted the impedance measurement with the Audio Precision System One software.
Footnote 1: EPDR is the resistive load that gives rise to the same peak dissipation in an amplifier's output devices as the loudspeaker. See "Audio Power Amplifiers for Loudspeaker Loads," JAES, Vol.42 No.9, September 1994, and stereophile.com/reference/707heavy/index.html.
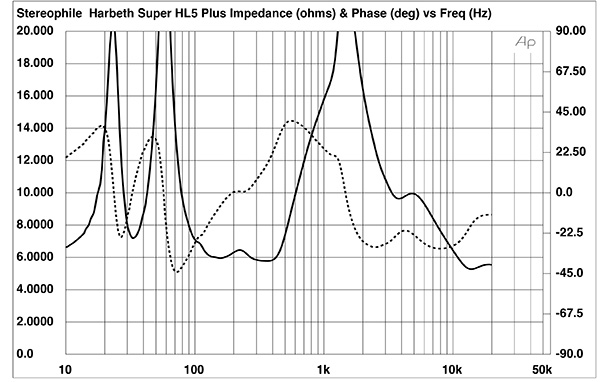
Fig.1 Harbeth Super HL5plus XD, electrical impedance (solid) and phase (dashed) (2 ohms/vertical div.).
My B-weighted estimate of the Super HL5plus's sensitivity was 85.7dB/2.83V/m, which is within experimental error of the specified 86dB. The Super HL5plus's nominal impedance is specified as "6 ohms, easy to drive." The speaker's impedance magnitude (solid trace) is higher than 6 ohms for almost all the audioband, dropping slightly below that value between 270Hz and 430Hz. The minimum magnitude was 5.8 ohms at 362Hz, which does suggest that this speaker is a relatively easy load. However, the equivalent peak dissipation resistance, or EPDR (footnote 1), lies below 4 ohms in three regions: between 73Hz and 147Hz; between 320Hz and 660Hz; and above 6kHz. The minimum values are 3.02 ohms at 93Hz and 2.54 ohms at 456Hz. If used with tube amplifiers, the Super HL5plus will work best with their 4 ohm output transformer taps.
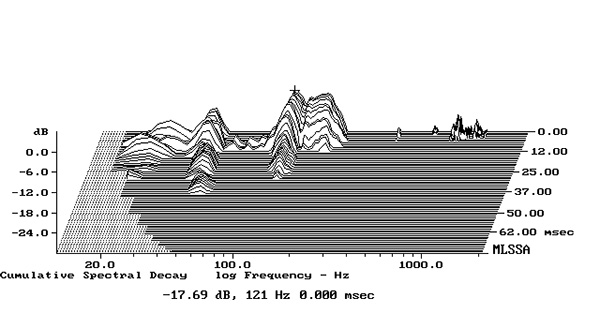
Fig.2 Harbeth Super HL5plus XD, cumulative spectral-decay plot calculated from output of accelerometer fastened to center of rear panel (measurement bandwidth, 2kHz).
The traces in fig.1 are free from the small discontinuities that would suggest the existence of panel resonances. When I investigated the vibrational behavior of the enclosure with a plastic-tape accelerometer, I found resonant modes at 121Hz and 180Hz on the side and back panels (fig.2) and another, at 230Hz, on the top panel. These modes were all relatively low in level, but all had a relatively low Q (Quality Factor), so they might still be excited by music.
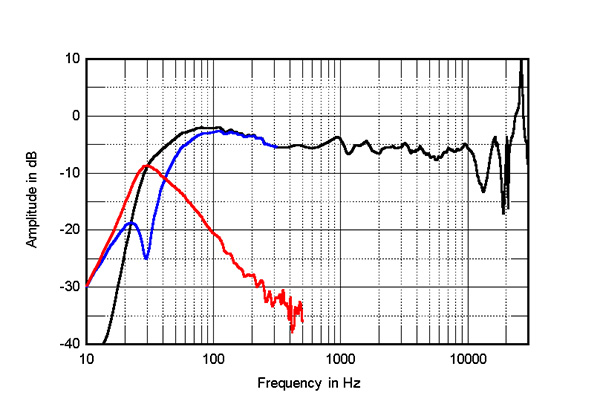
Fig.3 Harbeth Super HL5plus XD, anechoic response on super-tweeter axis at 50", averaged across 30° horizontal window and corrected for microphone response, with the nearfield woofer (blue) and port (red) responses and their complex sum (black), respectively plotted below 300Hz, 400Hz, and 300Hz.
The Super HL5plus's impedance-magnitude plot has a saddle in the bass centered on 29Hz, which will be the tuning frequency of the port on the front baffle and which implies extended low frequencies. As expected from fig.1, the woofer's nearfield response (fig.3, blue trace) has the reflex notch at 29Hz. The output of the port peaks between 20Hz and 60Hz (fig.3, red trace) and the port's upper-frequency rolloff is clean. The complex sum of the woofer and port responses is shown as the black trace below 300Hz in fig.3. The boost in the upper bass is at least partly an artifact of the nearfield measurement technique. However, the Harbeth's reflex alignment appears to be slightly overdamped.
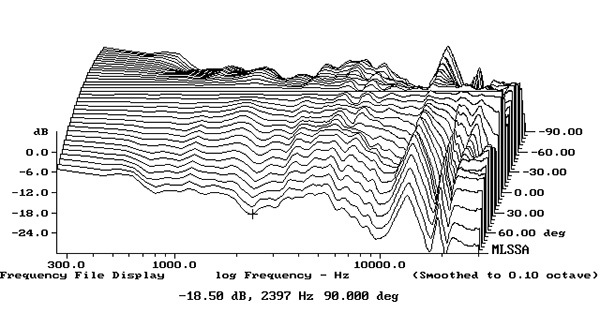
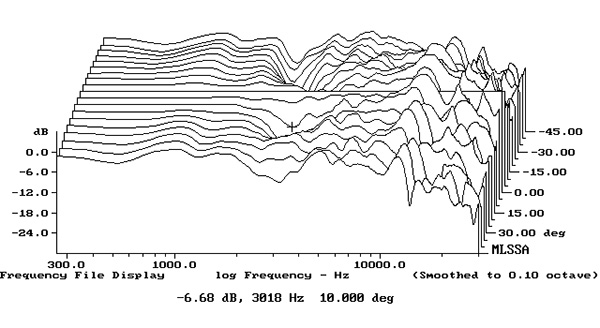
Fig.4 Harbeth Super HL5plus XD, lateral response family at 50", normalized to response on super-tweeter axis, from back to front: differences in response 90–5° off axis, reference response, differences in response 5–90° off axis.
The Harbeth speaker's farfield output averaged across a 30° horizontal window centered on the super-tweeter axis (fig.3, black trace above 300Hz) is impressively even, with small peaks balanced by small reductions in energy. There is a very slight downward slope in the treble, with then a sharp rolloff above 11kHz followed by a return to full level at 16.2kHz and then by a 15dB-high narrowband peak at 26.3kHz, the frequency the primary dome resonance of one of the tweeters. The cursor position in the speaker's horizontal dispersion graph (fig.4) suggests a lack of presence-region energy at extreme off-axis angles. The radiation pattern also narrows above 7kHz, presumably due to the relatively wide baffle.
Fig.5 Harbeth Super HL5plus XD, vertical response family at 50", normalized to response on super-tweeter axis, from back to front: differences in response 45–5° above axis, reference response, differences in response 5–45° below axis.
The Super HL5plus's dispersion in the vertical plane is shown in fig.5, with the off-axis responses normalized to that on the super-tweeter axis. With the 17"-high TonTräger stands, which KM used for his review, this axis is 39" from the floor. A survey performed by Thomas J. Norton in the 1990s found that the typical ear height of a seated listener was 36" from the floor. Fortunately, the Harbeth's response 5° below the super-tweeter axis is virtually identical to that on-axis. A suckout at 3kHz develops 10° above and below the reference, presumably related to the 3.5kHz crossover between the bass/mid driver and the tweeter.
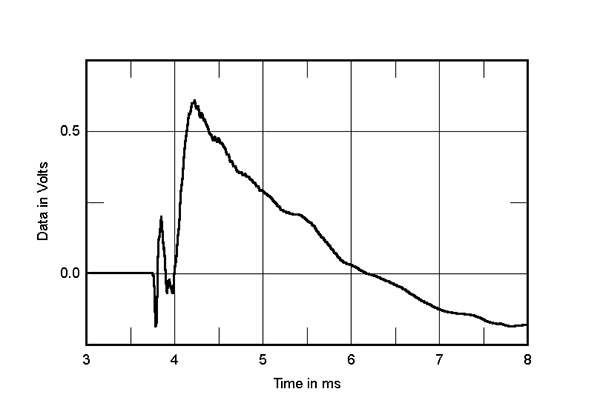
Fig.6 Harbeth Super HL5plus XD, step response on super-tweeter axis at 50" (5ms time window, 30kHz bandwidth).
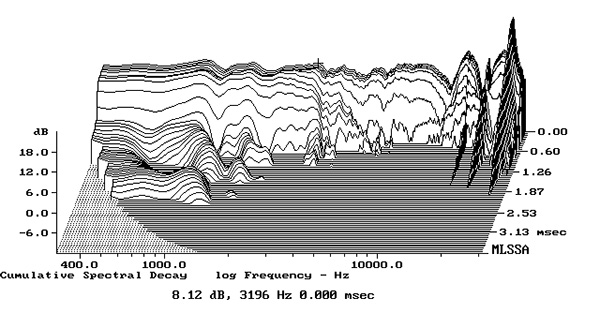
Fig.7 Harbeth Super HL5plus XD, cumulative spectral-decay plot on super-tweeter axis at 50" (0.15ms risetime).
In the time domain, fig.6 shows the Super HL5plus's step response on the super-tweeter axis. The super tweeter is connected in inverted acoustic polarity, and its output arrives first at the microphone. The two lower-frequency drive units, which are connected in positive acoustic polarity, arrive next, that of the tweeter arriving before that of the woofer. The positive-going decay of the super tweeter's step blends with the beginning of the tweeter's step, but the decay of the tweeter's step arrives a little too early to blend smoothly with the start of the woofer's step. This suggests that the optimal listening axis will be between the two tweeters, although the Harbeth manual says to use a stand that optimally brings "ears level with tweeters."
The Super HL5plus's cumulative spectral-decay, or waterfall, plot (fig.7) is dominated by ridges of delayed energy at the frequencies of the top-octave and ultrasonic peaks seen in fig.3. Other than a slight discontinuity at the cursor position in this graph, just below 3.2kHz, the Harbeth's waterfall plot is commendably clean.
I was interested in examining how the Harbeth Super HL5plus XD measured because it is the same size as the 1970s-era Spendor BC1, which I used for a while back then, and features a superficially similar array of drive units. I remember that distant ancestor offering excellent measured behavior for its time, but the Super HL5plus's measurements are even better overall. In addition, its low frequencies will be better-controlled than the BC1's, which were always a touch loosey-goosey.—John Atkinson
Footnote 1: EPDR is the resistive load that gives rise to the same peak dissipation in an amplifier's output devices as the loudspeaker. See "Audio Power Amplifiers for Loudspeaker Loads," JAES, Vol.42 No.9, September 1994, and stereophile.com/reference/707heavy/index.html.


