Sidebar 3: DAC1-20 Measurements
Like the original DAC1, the DAC1-20 performed very well on the bench. There was nothing in the measurements, however, that would indicate the sonic differences I've described. Rather than rehash the plots, the DAC1's measurements can be found starting on p.169 of the June 1991 issue. Any differences between the two units' performances are noted.
The two versions have identical output levels (a low 1.74V at full scale), frequency response, and de-emphasis error. Linearity, shown in fig.1, was superb, exhibiting 0.16dB error (left channel) and 0.03dB error (right channel) at –90dB. This remarkable performance isn't surprising in light of the rigorous manufacturing and testing procedures that go into the UltraAnalog DACs (see my review of the Stax DAC-X1t in August 1990 for a description of these procedures).
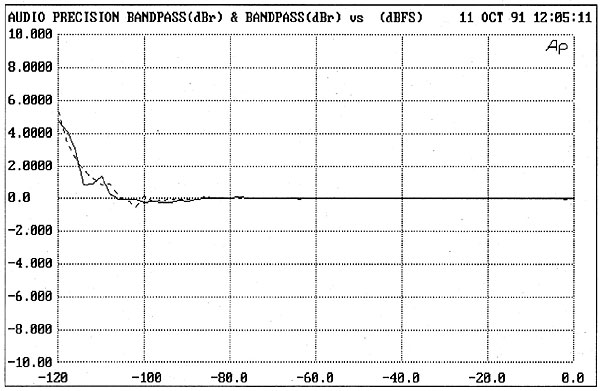
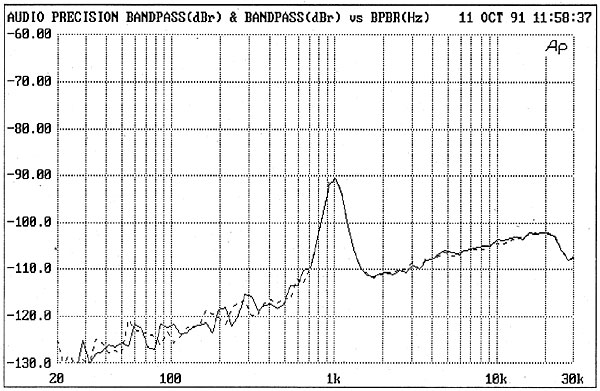
Fig.1 Audio Research DAC1-20, left-channel departure from linearity (2dB/vertical div.).
In addition, the low noise floor, spot-on linearity, and almost perfect matching between channels can be seen in fig.2, a third-octave spectrum analysis of the DAC1-20's output when decoding a –90.01dB dithered 1kHz sinewave. If you look closely, you can see that the plot comprises two traces, solid and dashed, but appears almost as one due to the virtually identical performance of both channels within the DAC.
Fig.2 Audio Research DAC1-20, 1/3-octave spectrum of dithered 1kHz tone at –90dBFS with noise and spuriae (10dB/vertical div.).
In short, the DAC1-20 exhibited excellent bench performance, as did the DAC1.—Robert Harley