Sidebar 3: Measurements
I performed a full set of measurements on the ARCAM A25 using my Audio Precision SYS2722 system. The amplifier is specified as having a maximum output power of 100Wpc into 8 ohms; I preconditioned the A25 before the measurements by following the CEA's recommendation of running it at one-eighth that power into 8 ohms for 30 minutes. Following that period, the top panel was warm, at 98.4°F (36.9°C), and the grilles over the internal heatsinks warmer, at 102.8°F (39.3°C).
Looking first at the A25's unbalanced line inputs, the amplifier preserved absolute polarity at all of its outputs. The volume control operated in accurate 0.5dB steps, and with the volume control set to the maximum, "99," the voltage gain at 1kHz was 44.6dB into 8 ohms from the loudspeaker outputs, 27.8dB from the headphone outputs, and 13.5dB from the Preamplifier outputs. The line input impedance isn't specified. I measured just below 10k ohms from 20Hz to 20kHz.
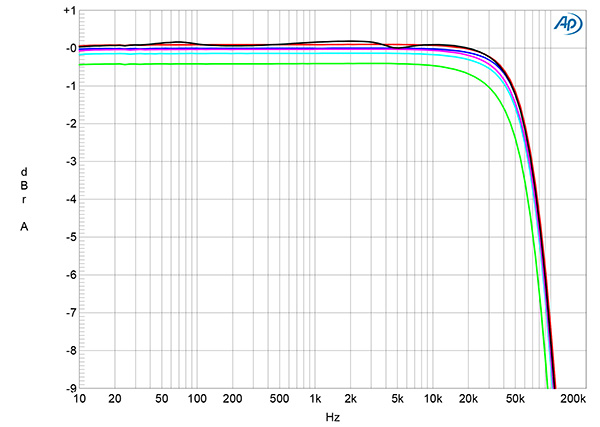
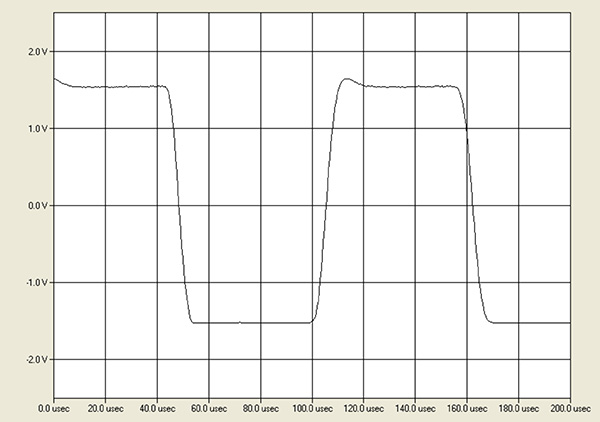
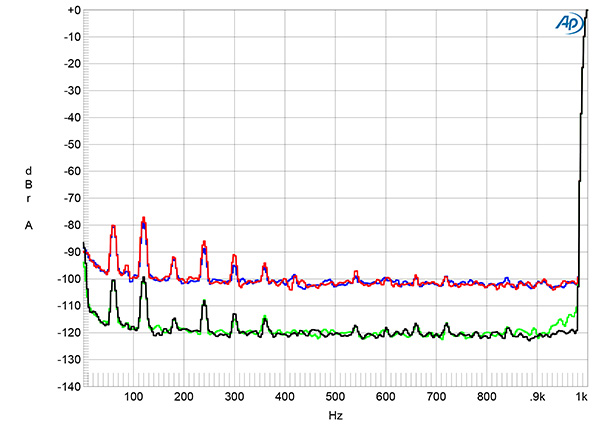
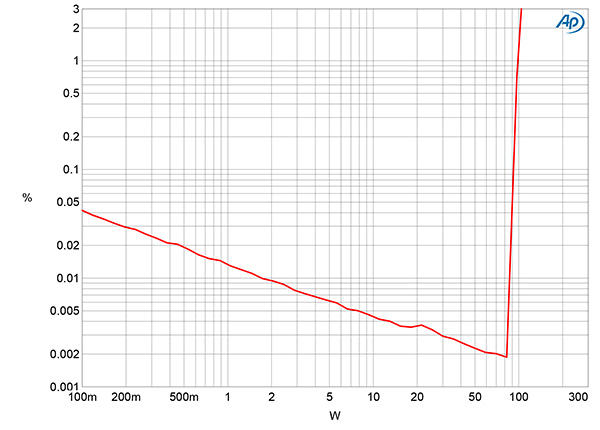
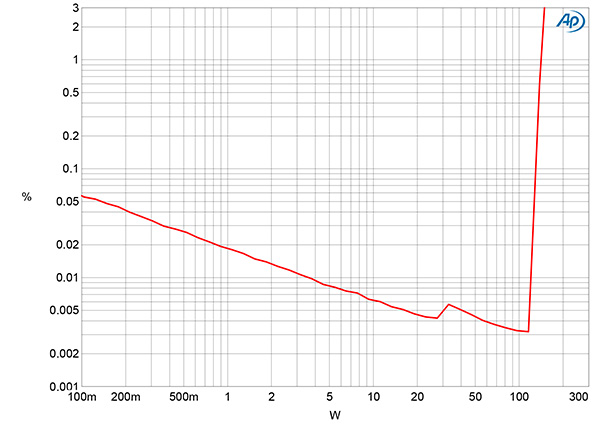
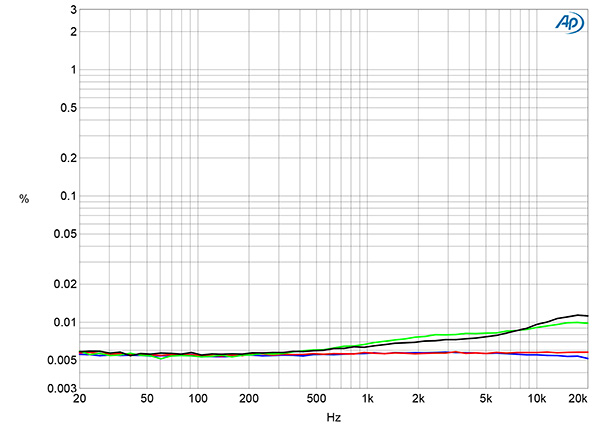
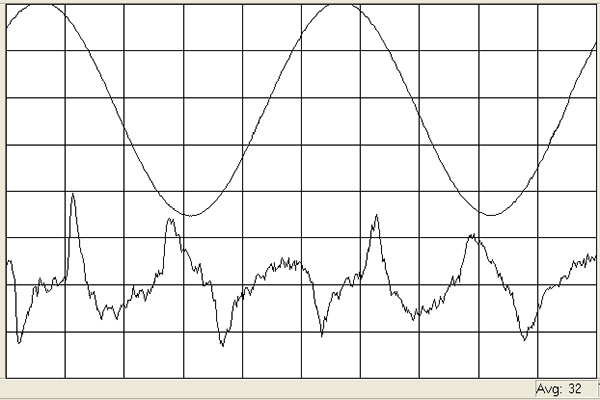
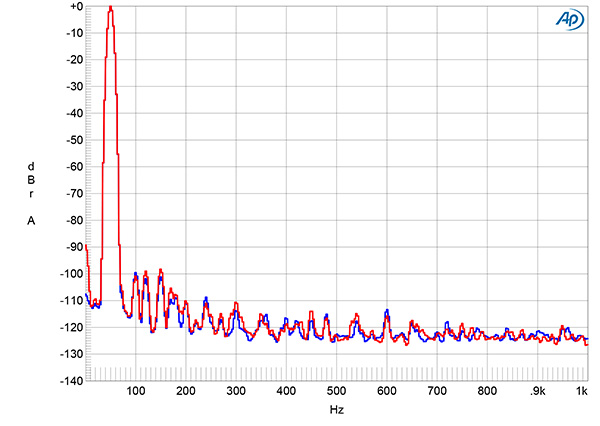
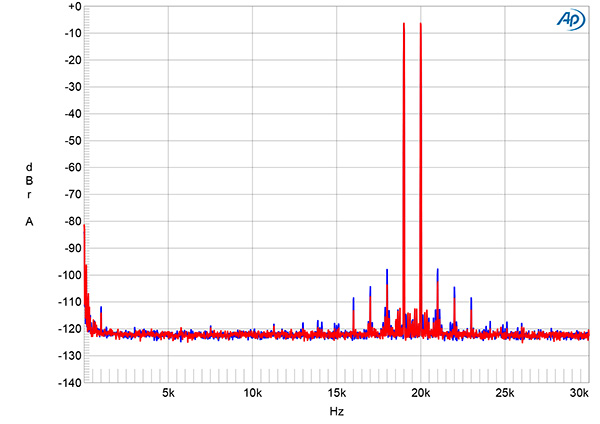
Fig.1 ARCAM A25, line input, frequency response at 2.83V into: simulated loudspeaker load (gray), 8 ohms (left channel blue, right red), 4 ohms (left cyan, right magenta), 2 ohms (green) (1dB/vertical div.).
Fig.2 ARCAM A25, line input, small-signal, 10kHz squarewave into 8 ohms.
The Preamplifier output impedance was 35 ohms at 1kHz and 20kHz, rising to 228 ohms at 20Hz, which is presumably due to the presence of a series output-coupling capacitor. The headphone output impedance was a low 1.3 ohms at all audio frequencies. The loudspeaker output impedance, including 6' of spaced-pair speaker cable, was low in the bass and midrange, at 0.13 ohm, rising to 0.16 ohm at the top of the audioband. Consequently, the modulation of the A25's frequency response due to the Ohm's law interaction between this impedance and the impedance of our standard simulated loudspeaker was minimal (fig.1, gray trace). The amplifier's response into resistive loads was flat in the audioband, with its output into 8 ohms (blue and red traces) down by 3dB at 70kHz. Both the very close channel balance and the overall response were preserved at lower settings of the volume control and from the headphone output. The A25's reproduction of a 10kHz squarewave (fig.2) had short risetimes, but with a hint of damped overshoot on the positive-going peaks.
Fig.3 ARCAM A25, line input, spectrum of 1kHz sinewave, DC–1kHz, at 1Wpc into 8 ohms with volume control set to the maximum (left channel blue, right red), and to –20dB (left green, right gray) (linear frequency scale).
Channel separation was good, at >70dB across the audioband in both directions. The wideband, unweighted signal/noise ratio, taken with the unbalanced input shorted to ground and the volume control set to its maximum, was an okay 62.1dB ref. 2.83V, which is equivalent to 1W into 8 ohms, in both channels. This ratio improved to 67.6dB when the measurement bandwidth was restricted to the audioband, and to 70.4dB when A-weighted. Repeating the S/N ratio measurements with the volume control set to –20dB increased the S/N ratios by 18dB. This improvement with the lower volume control setting can be seen in fig.3. The blue and red traces show the amplifier's low-frequency noisefloor at 1Wpc into 8 ohms with the volume control set to its maximum; the green and gray traces show the noisefloor spectrum at the control set to –20dB and with the input signal increased by the same 20dB so that the output level remains at 2.83V. The levels of both random noise and the harmonics of the AC supply frequency are reduced by almost 20dB at the lower setting of the volume control.
Fig.4 ARCAM A25, line input, distortion (%) vs 1kHz continuous output power into 8 ohms.
Fig.5 ARCAM A25, line input, distortion (%) vs 1kHz continuous output power into 4 ohms.
Figs.4 and 5 respectively plot how the THD+noise percentage varies with output power into 8 ohms and 4 ohms with both channels driven. The downward slope of the traces indicates that the distortion lies below the noise up to the actual onset of clipping. At our usual definition of clipping, which is when the THD+N reaches 1%, the A25 met its specified output power of 100Wpc into 8 ohms (20dBW) but fell slightly short of the specified 165W into 4 ohms (19.16dBW), clipping at 150Wpc into this load (18.75dBW).
Fig.6 ARCAM A25, line input, THD+N (%) vs frequency at 12.67V into: 8 ohms (left channel blue, right red), 4 ohms (left green, right gray).
Fig.6 shows how the THD+N percentage changed with frequency at 12.67V, which is equivalent to 20W into 8 ohms and 40W into 4 ohms. The distortion into 8 ohms (blue and red traces) and 4 ohms (green and gray traces) is very low. It rises into 4 ohms by only a little in the top two octaves, which suggests that the amplifier has a wide open-loop bandwidth.
Fig.7 ARCAM A25, line input, 1kHz waveform at 40W into 4 ohms, 0.0021% THD+N (top); distortion and noise waveform with fundamental notched out (bottom, not to scale).
Fig.8 ARCAM A25, line input, spectrum of 50Hz sinewave, DC–1kHz, at 40Wpc into 4 ohms (left channel blue, right red, linear frequency scale).
Fig.9 ARCAM A25, line input, HF intermodulation spectrum, DC–30kHz, 19+20kHz at 40Wpc peak into 4 ohms (left channel blue, right red, linear frequency scale).
The THD+N waveform at 40W into 4 ohms (fig.7) is difficult to interpret but appears to be primarily the third harmonic. Spectral analysis (fig.8) indicates that the second harmonic is present at almost the same level as the third, but both lie close to –100dB (0.001%), which is also the level of the spurious, supply-related tone at 120Hz. Intermodulation distortion was also superbly low in level, even into 4 ohms (fig.9).


