Sidebar 3: Measurements
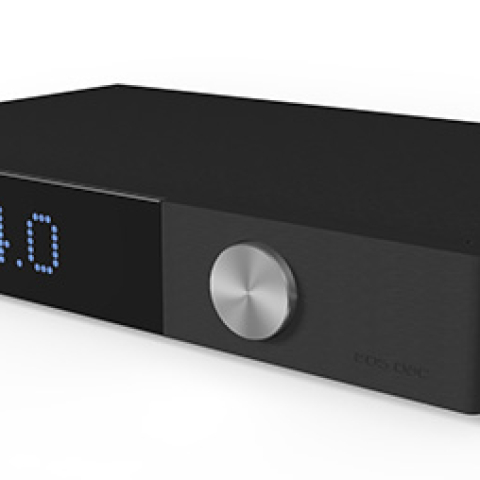
I measured the Arcam irDAC-II with my Audio Precision SYS2722 system (see the January 2008 As We See It"), using the Audio Precision's optical and electrical digital outputs, USB data sourced from my MacBook Pro running on battery power with Pure Music 3.0 playing WAV and AIFF test-tone files, and with the same files played on an iPhone 6S, an iPad2, and an HTC Android phone via Bluetooth. Apple's USB Prober utility identified the irDAC-II as "irDAC-II" from "ARCAM," and revealed that its USB port operated in the optimal isochronous asynchronous mode. Apple's AudioMIDI utility revealed that, via USB, the Arcam accepted 32-bit float and 24-bit integer data sampled at all rates from 44.1 to 384kHz. The optical input locked to datastreams with sample rates up to 96kHz, the coaxial S/PDIF inputs locked to streams of up to 192kHz-sampled data. Via Bluetooth, the Arcam was identified as "irDAC2 f93a."
The Arcam's maximum output level at 1kHz was 2.15V from both its variable and fixed line-level RCA jacks, 4.01V from its headphone jack, and all three outputs preserved absolute polarity (ie, were non-inverting). The output impedance from the fixed and variable outputs was a low 47 ohms from 20Hz to 20kHz, and the impedance from the headphone jack was a constant 1 ohm across the same range. The irDAC-II's impulse response with data sampled at 44.1kHz (fig.1) revealed the reconstruction filter to be a conventional FIR type, with time-symmetrical ringing.
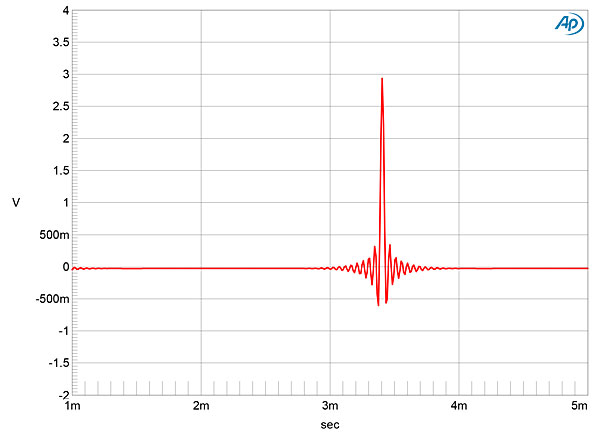
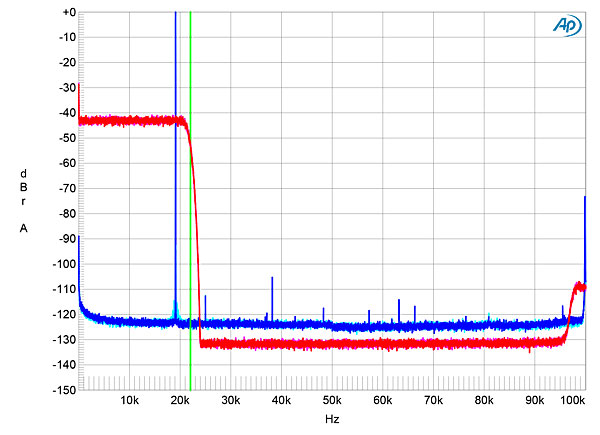
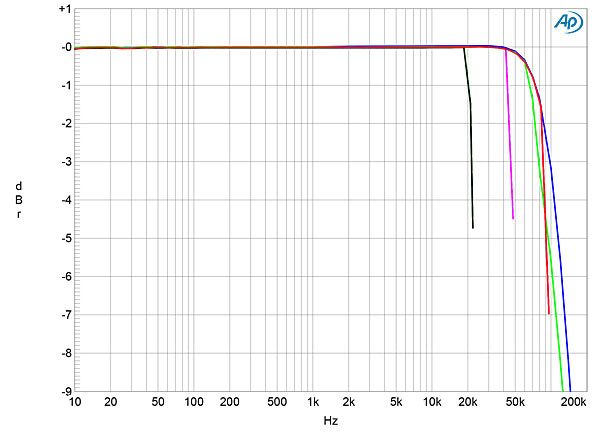
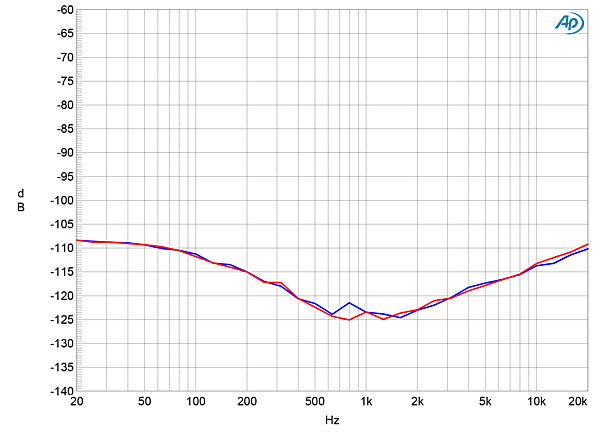
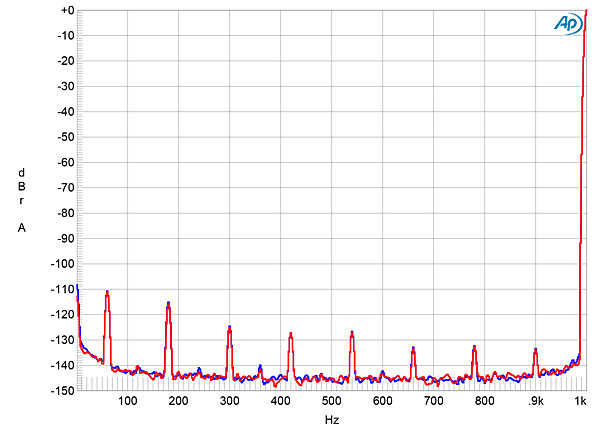
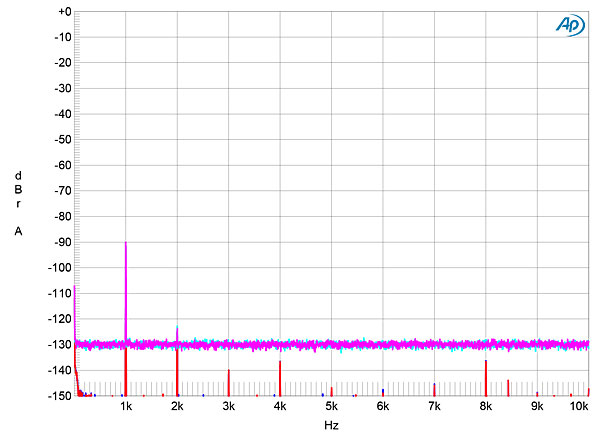
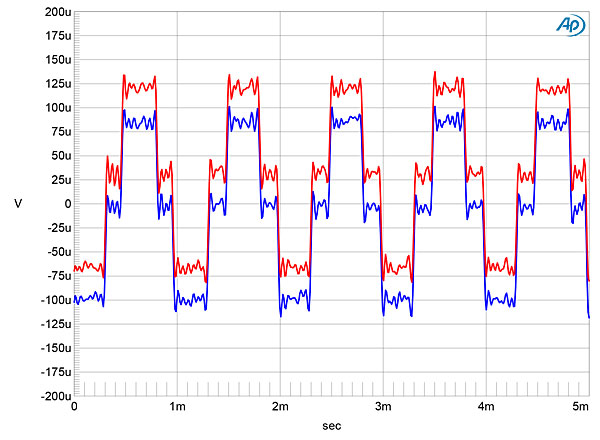
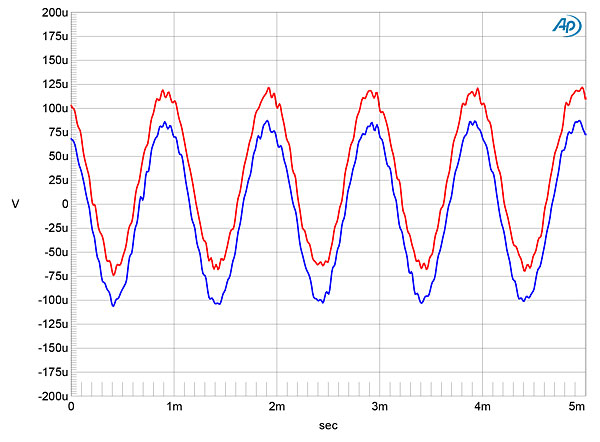
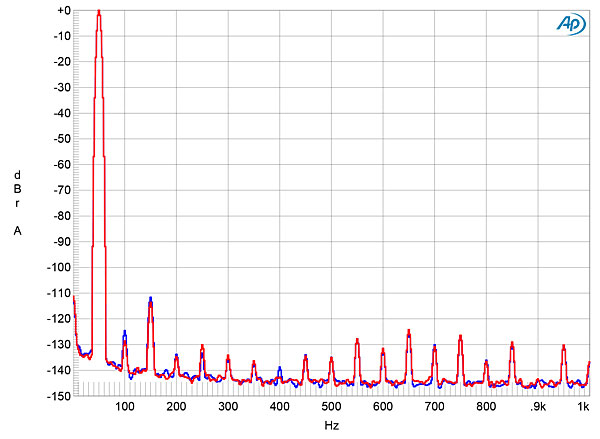
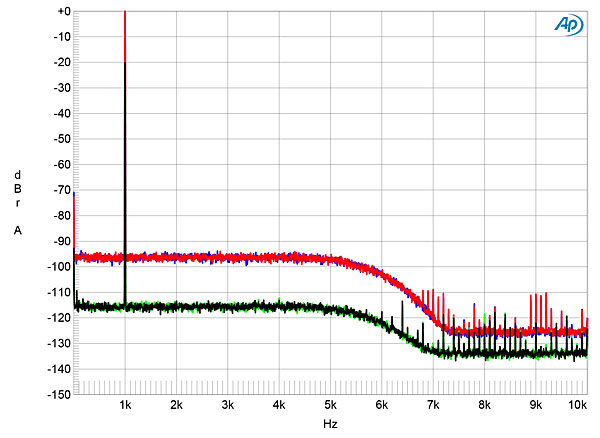
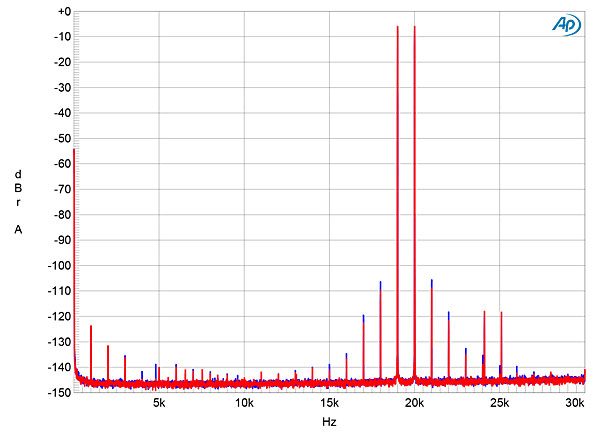
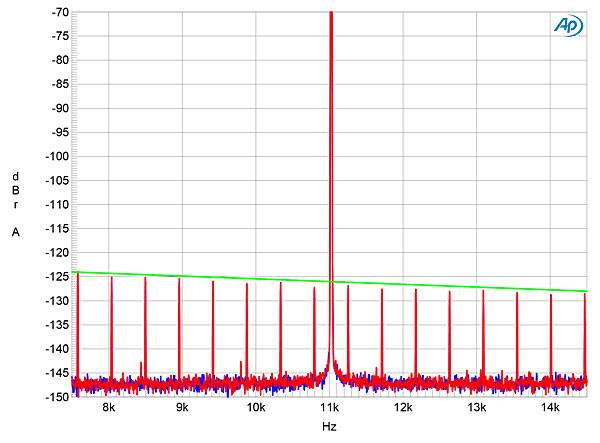
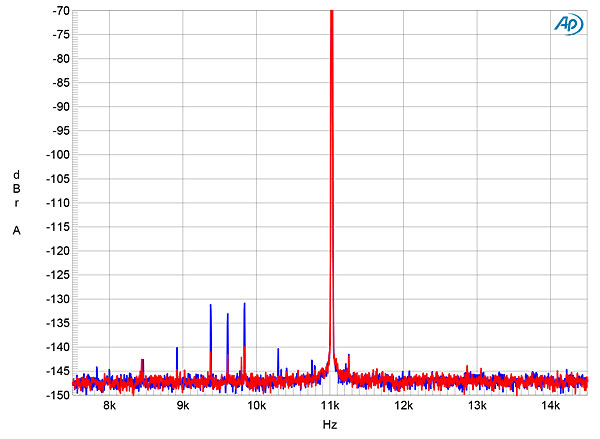
Fig.1 Arcam irDAC-II, impulse response (one sample at 0dBFS, 44.1kHz sampling, 4ms time window).
The magenta and red traces in fig.2 show that this filter rolls off rapidly above the audioband, with the aliased product at 25kHz of a full-scale tone at 19.1kHz (cyan and blue traces) suppressed by >110dB. Fig.3 is a more conventional way of showing frequency response, in this instance taken with data sampled at 44.1, 96, 192, and 384kHz. In each case, the response falls sharply just below half the sample rate, and other than with 384kHz data, the channels are superbly well matched. At 384kHz, the right channel (green trace) rolls off a little earlier than the left (blue), reaching –3dB at 80kHz compared with 100kHz. Figs. 2 and 3 were taken from the fixed outputs; the responses were identical from the variable and headphone outputs.
Fig.2 Arcam irDAC-II, wideband spectrum of white noise at –4dBFS (left channel red, right magenta) and 19.1kHz tone at 0dBFS (left blue, right cyan), with data sampled at 44.1kHz (20dB/vertical div.).
Fig.3 Arcam irDAC-II, frequency response at –12dBFS into 100k ohms with data sampled at: 44.1kHz (left channel green, right gray), 96kHz (left cyan, right magenta), 192kHz (left blue, right red), 384kHz (left blue, right green) (1dB/vertical div.).
Channel separation (fig.4) was superb, at 125dB in both directions at 1kHz, and decreasing to a still-excellent 110dB at the top and bottom of the audioband, the former due to capacitive coupling somewhere in the circuit, the latter to the wall-wart supply's increasing impedance at low frequencies. The level of random background noise was very low, but some low-level spuriae were present at 60Hz and its odd-order harmonics (fig.5). Increasing the bit depth from 16 to 24 with a dithered 1kHz tone at –90dBFS dropped the noise floor by around 21dB (fig.6), suggesting that this inexpensive DAC offers close to 20-bit resolution, which is excellent. However, with 24-bit data (blue and red traces), the reduction in analog noise unmasks some distortion, the highest-level harmonic being the second. With an undithered 16-bit tone at –90.31dBFS (fig.7), the three DC voltage levels described by the data are very well defined, and other than 25µV DC offset in the right channel (red trace), the two channels match well. With 24-bit undithered data (fig.8), the Arcam output a well-formed sinewave despite the very low level of the tone.
Fig.4 Arcam irDAC-II, channel separation (5dB/vertical div.)
Fig.5 Arcam irDAC-II, spectrum with noise and spuriae of dithered 24-bit, 1kHz tone at 0dBFS (left channel blue, right red) (20dB/vertical div.).
Fig.6 Arcam irDAC-II, spectrum with noise and spuriae of dithered 1kHz tone at –90dBFS with: 16-bit data (left channel cyan, right magenta), 24-bit data (left blue, right red) (20dB/vertical div.).
Fig.7 Arcam irDAC-II, waveform of undithered 1kHz sinewave at –90.31dBFS, 16-bit TosLink data (left channel blue, right red).
Fig.8 Arcam irDAC-II, waveform of undithered 1kHz sinewave at –90.31dBFS, 24-bit TosLink data (left channel blue, right red).
Harmonic distortion at high signal levels was very low, even into 600 ohms (fig.9), with the third harmonic the highest in level from the line outputs at just –111dB (0.0003%). From the headphone outputs, the second harmonic was the highest in level, at the same –111dB. All the previous tests were taken with S/PDIF or USB data; as with Bluetooth-sourced data, the performance will greatly depend on the code used, whether aptX (Android phones and my MacBook Pro) or SBC (iPhones and iPads). I examined the behavior of these codecs in the measurements that accompanied our review of Arcam's rBlink. Basically, the superior-sounding aptX trades off low-level resolution in favor of preserving a random noise floor, whereas AAC seems to try to preserve resolution at the expense of noise-floor modulation and the introduction of enharmonic spuriae. However, even aptX introduces noise modulation, as can be seen in fig.10, which plots the spectrum of the Arcam's output as it decodes aptX-encoded Bluetooth data representing a 1kHz tone at 0dBFS (blue and red traces) and at –20dBFS (green and gray). The level of the random noise floor is related to the signal level. Incidentally, I created this graph using my MacBook Pro as the Bluetooth source; the only Android phone available to me produced around 2% of odd-order distortion with full-scale tones, even with its volume control set to –12dB.
Fig.9 Arcam irDAC-II, spectrum of 50Hz sinewave, DC–1kHz, at 0dBFS into 600 ohms (left channel blue, right red; linear frequency scale).
Fig.10 Arcam irDAC-II, spectrum of 1kHz sinewave, DC–10kHz, at 0dBFS (left channel blue, right red) and at –20dBFS (left green, right gray), both sourced from MacBook Pro via Bluetooth (linear frequency scale).
Intermodulation distortion was extremely low (fig.11), as was the irDAC-II's rejection of word-clock jitter via its S/PDIF and USB inputs (fig.12), with the odd-order harmonics of the LSB-level, low-frequency squarewave at the correct level (green line), and no other sidebands visible. With 24-bit J-Test data (fig.13), there are no sidebands present but some low-level spurious tones can be seen. Overall, its measurements suggests that the inexpensive irDAC-II is a conventional but well-engineered D/A processor.—John Atkinson
Fig.11 Arcam irDAC-II, HF intermodulation spectrum, DC–30kHz, 19+20kHz at 0dBFS into 600 ohms, 44.1kHz data (left channel blue, right red; linear frequency scale).
Fig.12 Arcam irDAC-II, high-resolution jitter spectrum of analog output signal, 11.025kHz at –6dBFS, sampled at 44.1kHz with LSB toggled at 229Hz: 16-bit TosLink data (left channel blue, right red). Center frequency of trace, 11.025kHz; frequency range, ±3.5kHz.
Fig.13 Arcam irDAC-II, high-resolution jitter spectrum of analog output signal, 11.025kHz at –6dBFS, sampled at 44.1kHz with LSB toggled at 229Hz: 24-bit TosLink data (left channel blue, right red). Center frequency of trace, 11.025kHz; frequency range, ±3.5kHz.