Sidebar 3: Measurements
I measured the Topping DM7 with my Audio Precision SYS2722 system, repeating some measurements with the higher-performance APx500. I fed data to the DM7's USB input with my MacBook Pro, running on battery power, and used ¼" TRS-XLR adapters for feeding the Audio Precision's balanced inputs. As the Audio Precision analyzers are two-channel devices, I performed a complete set of tests with the DM7's channels 1 and 2 analog outputs, repeating some of the tests on channels 3/4, 5/6, and 7/8.
Apple's AudioMIDI utility indicated that the Topping DM7 accepts 24- and 32-bit integer data sampled at all rates from 44.1kHz to 192kHz. Apple's USB Prober app identified the DM7 as "DM7" from "Topping" and confirmed that the USB port operated in the optimal isochronous asynchronous mode. The DM7's analog outputs preserved absolute polarity (ie, were noninverting), and the default maximum output was 4.16V. The output impedance was a low 101 ohms from 20Hz to 20kHz.
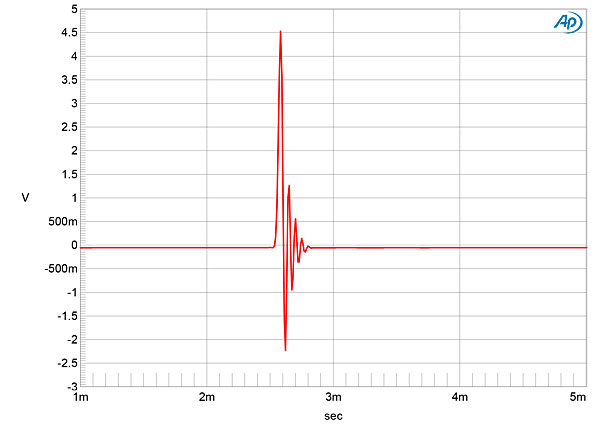
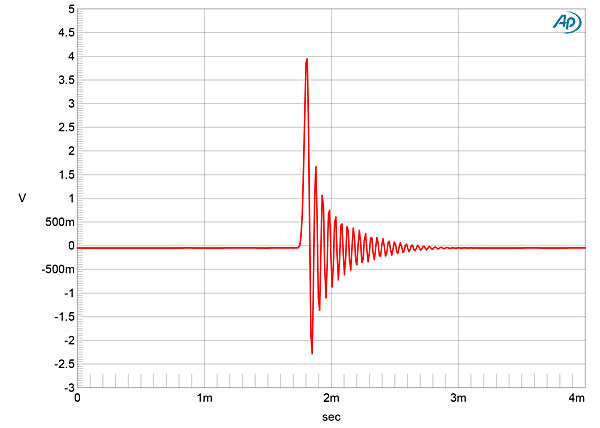
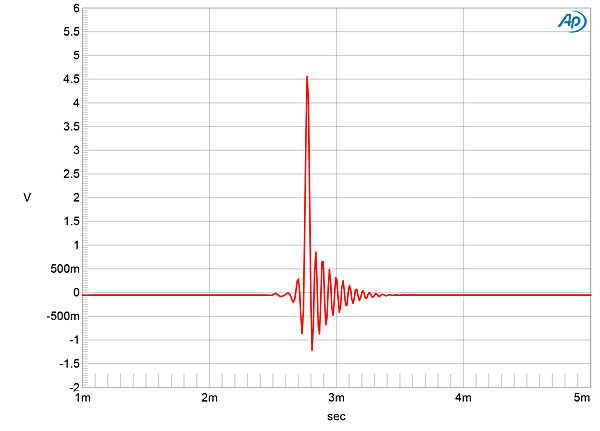
The DM7's ES9038PRO D/A converter chip offers a choice of seven oversampling reconstruction filters. The F1, F5, and F6 filters' impulse responses with 44.1kHz data (fig.1) are typical of a linear-phase reconstruction filter, with equal amounts of ringing before and after the single sample at 0dBFS. F4 is a linear-phase filter, but with much less ringing. The F2 filter's impulse response indicates that it is a short minimum-phase type, with all the ringing following the single full-scale sample (fig.2), while F3 is a longer minimum-phase type (fig.3). The F7 filter is a hybrid type, with an impulse response (fig.4) familiar from other D/A processors that use ESS DAC chips (footnote 1).


 An increase from 16 bits to 24 bits with dithered data representing a 1kHz tone at –90dBFS (fig.9) lowered the Topping DM7's noisefloor by 18dB, implying resolution of 19 bits, which is good. When I played undithered data representing a tone at exactly –90.31dBFS, the waveform was symmetrical, with the three DC voltage levels described by the data well-resolved, though overlaid with some low-level, high-frequency noise (fig.10).
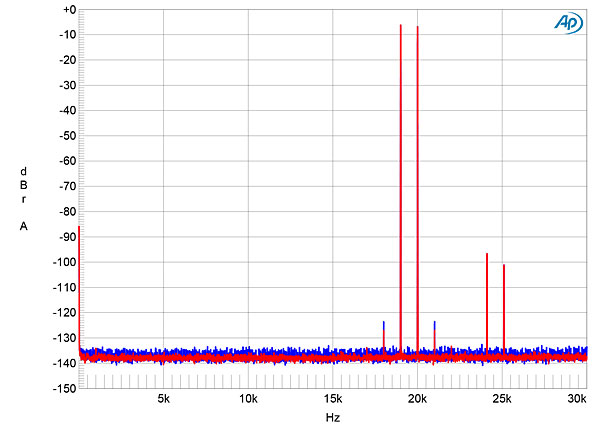
 As the Topping DM7 produced very low levels of distortion, I used the high-resolution APx500 analyzer to examine the harmonic distortion. With a full-scale 1kHz tone and the volume control set to its maximum, the THD+noise reading with a 200k ohm load was dominated by noise, measuring 0.001%, with the third harmonic the highest in level, at just –127dB (fig.11). When I reduced the load impedance to the punishing 600 ohms, the third harmonic, while higher in level, still lay at a vanishingly low –117dB (0.00014%, fig.12). Second-order intermodulation distortion was nonexistent when the DAC was fed an equal mix of 19 and 20kHz tones with a peak level of 0dBFS (fig.13). Though aliased images of the primary tones appeared above the audioband with the slow-rolloff filters (fig.14), actual intermodulation products were still absent.


Footnote 1: See, for example, fig.5 here. Footnote 2: My thanks to Jürgen Reis of MBL for suggesting this means of displaying the performance of a DAC's reconstruction filter.
Fig.1 Topping DM7, F1 impulse response (one sample at 0dBFS, 44.1kHz sampling, 4ms time window).
Fig.2 Topping DM7, F2 impulse response (one sample at 0dBFS, 44.1kHz sampling, 4ms time window).
Fig.3 Topping DM7, F3, impulse response (one sample at 0dBFS, 44.1kHz sampling, 4ms time window).
Fig.4 Topping DM7, F7, impulse response (one sample at 0dBFS, 44.1kHz sampling, 4ms time window).
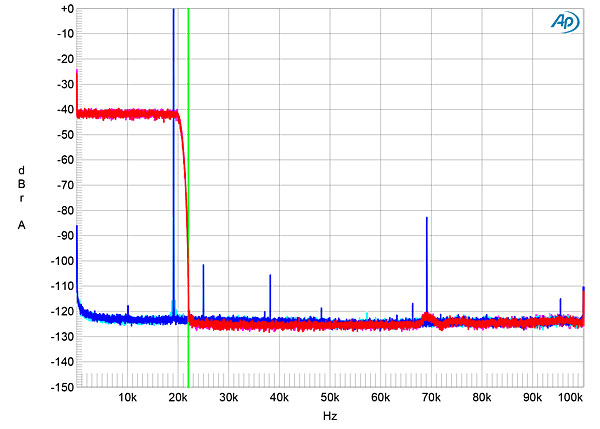
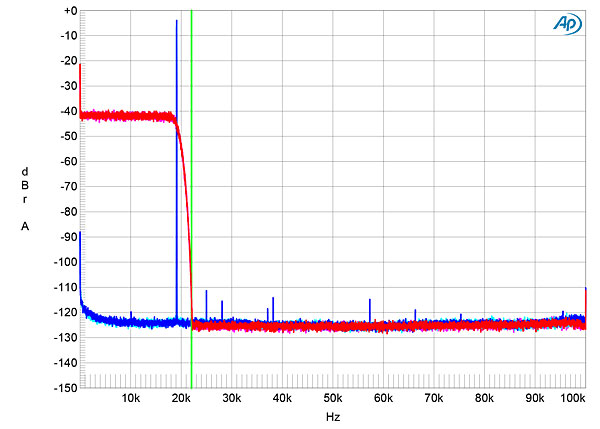
With 44.1kHz white-noise data (footnote 2), F1 and F6 rolled off rapidly above the audioband (fig.5, magenta and red traces), reaching full stop-band attenuation at half the sample rate (indicated by the vertical green line). They are therefore apodizing types. As expected from their short impulse responses, F2 and F4 offered slow ultrasonic rolloffs with 44.1kHz data (fig.6), not reaching full stop-band attenuation until 28kHz. With a full-scale 19.1kHz tone (cyan, blue), the slow rolloff means that the aliased image at 25kHz is only suppressed by 25dB. The harmonics associated with the 19.1kHz tone were all extremely low in level, however. F7 is also an apodizing filter; it started rolling off in the top octave (fig.7), with the output at 20kHz down by 12dB at 16kHz. All the other filters were flat to 16kHz, but F2's, F4's, and F6's responses were –5dB, –3.4dB, and –4dB at 20kHz.
Fig.5 Topping DM7, F1, wideband spectrum of white noise at –4dBFS (left channel red, right magenta) and 19.1kHz tone at 0dBFS (left blue, right cyan) into 100k ohms with data sampled at 44.1kHz (20dB/vertical div.).
Fig.6 Topping DM7, F4, wideband spectrum of white noise at –4dBFS (channel 1 red, channel 2 magenta) and 19.1kHz tone at 0dBFS (channel 1 blue, channel 2 cyan) into 100k ohms with data sampled at 44.1kHz (20dB/vertical div.).
Fig.7 Topping DM7, F7, wideband spectrum of white noise at –4dBFS (channel 1 red, channel 2 magenta) and 19.1kHz tone at 0dBFS (channel 1 blue, channel 2 cyan) into 100k ohms with data sampled at 44.1kHz (20dB/vertical div.).
Channel separation (not shown) was superb, at >126dB in both directions below 1kHz. The low-frequency noisefloor (fig.8), taken with the volume control set to its maximum, was free from any power supply–related spuriae and had a very low level of random noise in the audioband. However, with 24-bit digital black data, 9mV of ultrasonic noise was present on the analog outputs, with a center frequency of 370kHz. Peculiarly, slightly more audioband noise was present on outputs 1 and 8, at opposite ends of the DM7's back panel, than there was on the other six outputs.
Fig.8 Topping DM7, spectrum with noise and spuriae of dithered 1kHz tone at 0dBFS with 24-bit data (channel 1 blue, channel 2 red) (20dB/vertical div.).
Fig.9 Topping DM7, spectrum with noise and spuriae of dithered 1kHz tone at –90dBFS with: 16-bit data (channel 1 cyan , channel 2 magenta), 24-bit data (channel 1 blue, channel 2 red) (20dB/vertical div.).
Fig.10 Topping DM7, waveform of undithered 1kHz sinewave at –90.31dBFS, 16-bit data (channel 1 blue, channel 2 red).
Fig.11 Topping DM7, 24-bit data, spectrum of 1kHz sinewave, DC–1kHz, at 0dBFS into 200k ohms (channel 1 blue, channel 2 red; linear frequency scale).
Fig.12 Topping DM7, 24-bit data, spectrum of 50Hz sinewave, DC–1kHz, at 0dBFS into 600 ohms (channel 1 blue, channel 2 red; linear frequency scale).
Fig.13 Topping DM7, F1, HF intermodulation spectrum, DC–30kHz, 19+20kHz at 0dBFS into 100k ohms, 44.1kHz data (channel 1 blue, channel 2 red; linear frequency scale).
Fig.14 Topping DM7, F2, HF intermodulation spectrum, DC–30kHz, 19+20kHz at 0dBFS into 100k ohms, 44.1kHz data (channel 1 blue, channel 2 red; linear frequency scale).
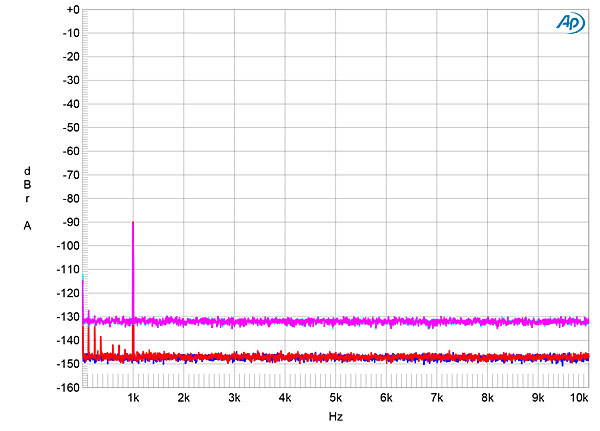
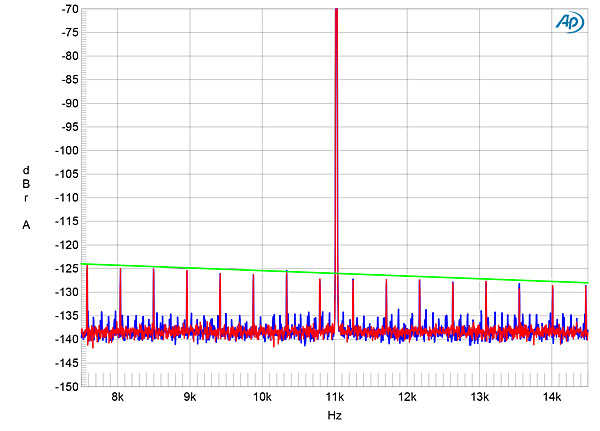
Although the Miller-Dunn J-Test isn't diagnostic with USB data, where the clock isn't embedded in the data, I looked at the spectrum of the DM7's output with undithered, 16-bit J-Test data. The odd-order harmonics of the undithered low-frequency, LSB-level squarewave all lie at the correct levels, indicated by the sloping green line in fig.15. This graph was taken with outputs 1 and 2 and, as mentioned earlier, the channel 1 spectrum (blue trace) is noisier between the sidebands than that of channel 2 (red).
Fig.15 Topping DM7, high-resolution jitter spectrum of analog output signal, 11.025kHz at –6dBFS, sampled at 44.1kHz with LSB toggled at 229Hz: 16-bit USB data (channel 1 blue, channel 2 red). Center frequency of trace, 11.025kHz; frequency range, ±3.5kHz.
The Topping DM7's measured performance is superb, even without taking its affordable price into account.—John Atkinson
Footnote 1: See, for example, fig.5 here. Footnote 2: My thanks to Jürgen Reis of MBL for suggesting this means of displaying the performance of a DAC's reconstruction filter.


