Sidebar 2: Measurements
A full set of measurements of the Pass Aleph 0 was made in the unbalanced mode—the mode used by DO for most of his listening. Selected measurements were also made in the balanced mode. Unless otherwise noted, the measurements shown are for the unbalanced configuration.
Following the 1/3-power, one-hour preconditioning test, the Aleph 0's heatsinks were hot, though not too hot to touch comfortably. The Aleph 0 is non-inverting in its unbalanced mode; in the balanced, pin 2 is configured as the positive leg, pin 3 the negative.
The Aleph 0's input impedance measured just under 6.5k ohms (unbalanced) and just over 7k ohms (balanced). These are low figures. While they should cause no difficulty with preamplifiers having a low output impedance (preferably 600 ohms or below), the Aleph 0 may be less than a perfect match to those few preamplifiers having output impedances over 1k ohm (some tube preamplifiers fall into this category, as do most passive "preamps"). [The subjective result of such a mismatch will be to roll off the lows prematurely, the result being too lean a tonal balance. Some preamplifiers will also clip prematurely into such a load.—Ed.]
The output impedance of the Aleph 0 was under 0.02 ohms at either 1kHz or 20Hz, increasing to a maximum of 0.025 ohms at 20kHz. Voltage gain into an 8 ohm load measured 25.8dB, balanced or unbalanced. DC offset was a rather high 180mV two minutes after turn-on, but decreased gradually to 60mV after 20 minutes, 38mV after 1 hour. The signal/noise ratio (unweighted, 22Hz–22kHz, ref. 1W into 8 ohms) measured 111dB unbalanced, 109dB balanced.
Fig.1 shows the frequency response of the Aleph 0 at 1W into 8 ohms, unbalanced. The balanced response, as well as the response at 2W into 4 ohms, is virtually identical, and isn't shown. The small blip at about 180Hz is a measurement artifact, and in any case is no more than 0.1dB. The Aleph 0's 10kHz squarewave response (fig.2) indicates an excellent risetime and only the slightest rounding of the leading edge. The 1kHz squarewave was close to perfect, and is not shown.
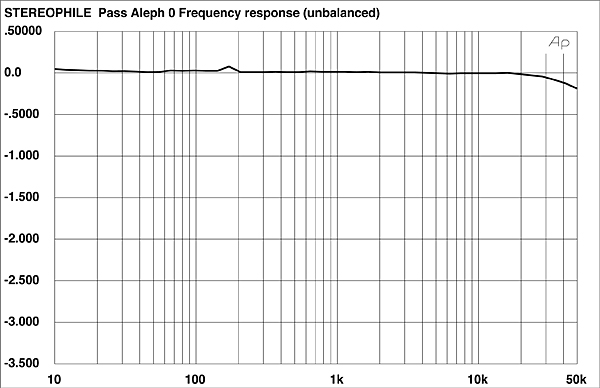
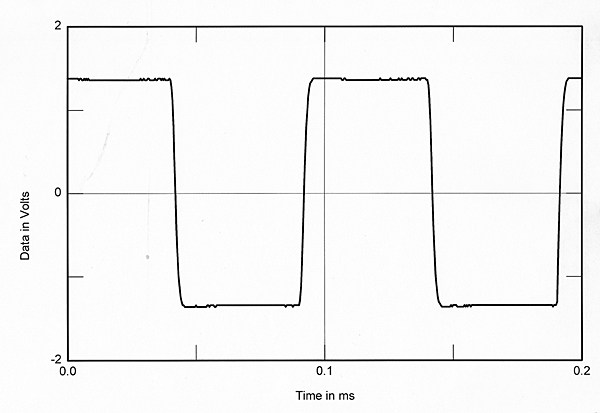
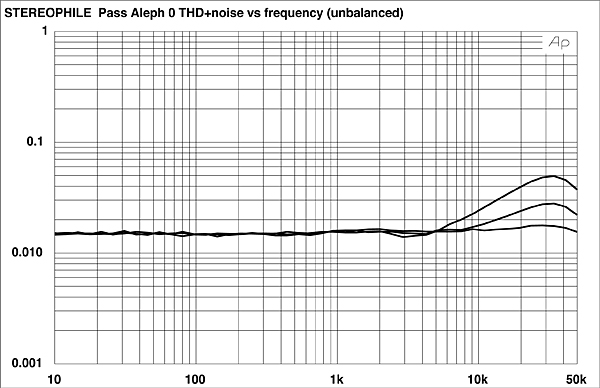
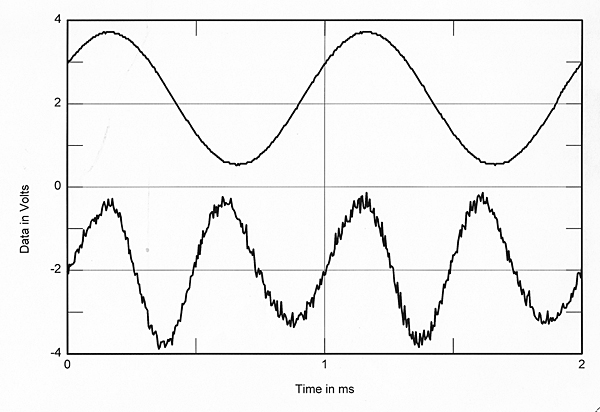
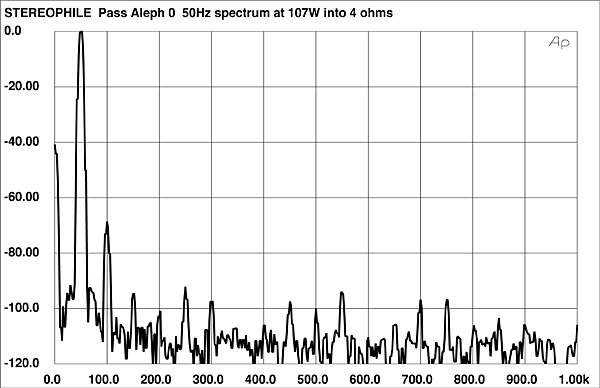
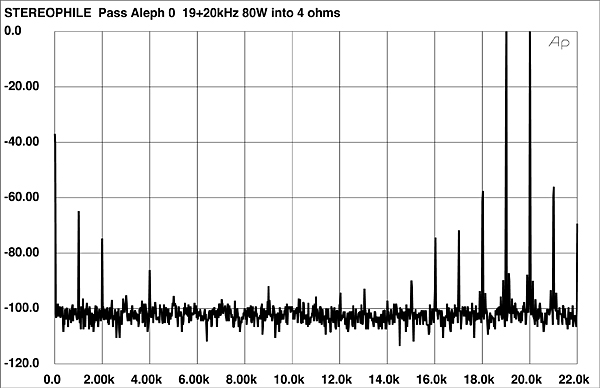
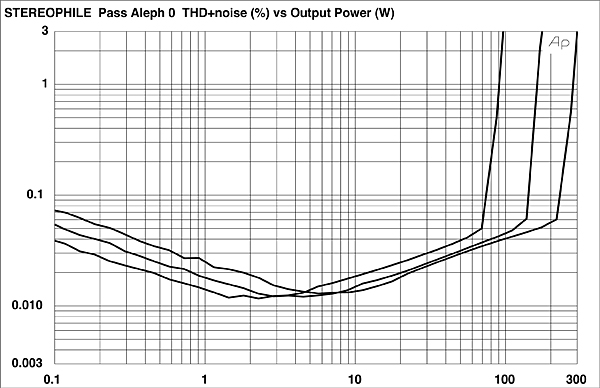
Fig.1 Pass Aleph 0, frequency response into 8 ohms (0.5dB/vertical div.).
Fig.2 Pass Aleph 0, 10kHz squarewave.
The THD+noise vs frequency curves are shown in fig.3. The result is astonishingly low for a single-ended amplifier, and any increase in THD into lower impedance loads is minimal. The result for a balanced input, not shown, was marginally better—about 0.0001% lower at high frequencies. The 1kHz distortion waveform at 10W output into 4 ohms (fig.4) indicates primarily second-harmonic content overlaid with noise. The waveforms into 8 ohms and 2 ohms are virtually identical (second harmonic plus noise), and are not shown.
Fig.3 Pass Aleph 0, THD+noise (%) vs frequency at (from bottom to top at 20kHz): 1W into 8 ohms, 2W into 4 ohms, 4W into 2 ohms.
Fig.4 Pass Aleph 0, 1kHz waveform at 10W into 4 ohms (top); distortion and noise waveform with fundamental notched out (bottom, not to scale).
The spectrum of the Aleph 0's output reproducing 50Hz at a 107W output level into 4 ohms (2/3 the rated power of 160W) is shown in fig.5. All of the distortion artifacts are extremely low here. Only the second harmonic—at –68.6dB, or just under 0.04%—is greater than –90dB (0.003%). Fig.6 shows a similar spectrum, with the amplifier reproducing an equal combination of 19kHz and 20kHz sinewaves at 80W into 4 ohms (visible clipping was evident with this signal just above this power level). The spectrum shows the products resulting from intermodulation between these two frequencies. The largest artifacts here are at 18kHz and 21kHz (at approximately –56dB, or 0.15%), with the next largest at 1kHz (–65dB, or 0.06%). The spectrum at 43W into 8 ohms was very similar, and isn't shown.
Fig.5 Pass Aleph 0, spectrum of 50Hz sinewave, DC–1kHz, at 107W into 4 ohms (linear frequency scale). Note that the second harmonic at 100Hz is the highest in level at –68.6dB (0.04%).
Fig.6 Pass Aleph 0, HF intermodulation spectrum, DC–22kHz, 19+20kHz at 80W into 4 ohms (linear frequency scale).
The 1kHz, THD+N vs output power curves (at 1kHz) are shown in fig.7. The distortion characteristics are typical of a solid-state amplifier, remaining very low up to the knee of the curves, and increasing rapidly above that; there was nothing unexpected due to the single-ended design. The apparent drop in measured THD up to the 4W level is due to the true distortion lying below the amplifier's noise floor below that power level. The discrete clipping levels (at 1% THD+N) were 95W into 8 ohms (19.6dBW), 167W into 4 ohms (19.2dBW), and 279W into 2 ohms (18.5dBW), all of which are well above specification. (The wall voltage was 117V AC at these powers into 8 and 4 ohms, 116V AC into 2 ohms.)
Fig.7 Pass Aleph 0, distortion (%) vs output power into (from bottom to top at 10W): 2 ohms, 4 ohms, and 8 ohms.
Based on my previous experience with single-ended amplifiers (all of them tube designs), I expected mundane test-bench results at best from the Aleph 0. This was certainly not the case. Its measured performance was excellent across the board.—Thomas J. Norton