Sidebar 2: Measurements
I examined the MSB Analog DAC's measured behavior with Stereophile's loan sample of the top-of-the-line Audio Precision SYS2722 system (see www.ap.com and the January 2008 "As We See It"). All measurements were taken with the Analog DAC powered by the Analog Power Base and with the DAC's volume control, which operates in accurate 1dB steps, set to "0"—its maximum setting is "9," equivalent to 9dB higher than the nominal output level of 2.65V, this measured from both balanced and single-ended outputs. Both sets of outputs preserved absolute polarity (ie, were non-inverting), with the XLRs wired with pin 2 hot. The output impedance was 100 ohms balanced and 53 ohms single-ended.
I used my 2012-vintage Apple MacBook Pro, running on battery power, to examine the processor's performance via its USB port. Apple's USB Prober utility identified the MSB as having the Product String "MSB USB Audio 2.0" and confirmed that the Analog DAC operated in the preferred isochronous asynchronous mode. The USB port accepted 24-bit data with all sample rates from 32 to 384kHz, and the TosLink input worked with sample rates up to 192kHz, which is unusual—normally, the TosLink interface is not expected to operate with rates above 96kHz. All subsequent measurements were taken from the single-ended outputs.
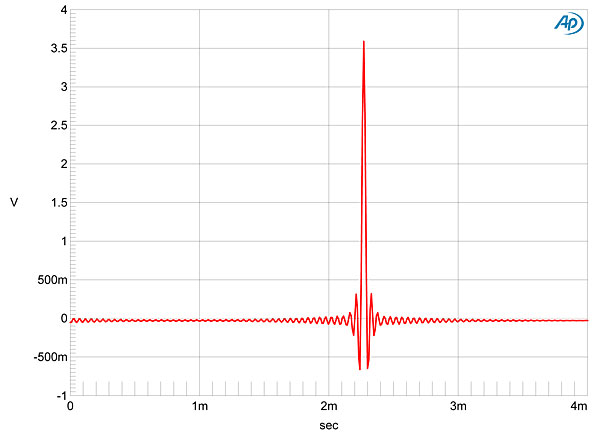
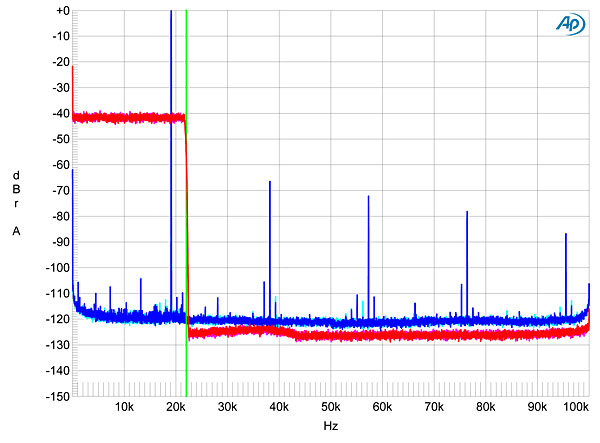
The MSB's impulse response with 44.1kHz data (fig.1) indicates that the reconstruction filter is linear-phase rather than minimum-phase, with the small amount of "ringing" symmetrical about the impulse—I use scare quotes because what you're actually seeing is the digital filter coefficients mapped in time. The red trace in fig.2 reveals that this filter is an apodizing type—ie, it has a null at the Nyquist frequency (half the sample rate, which I have indicated on this graph with a vertical green line)—and thus should remove all the Nyquist ringing that will have occurred upstream when the recording was made. However, you can see that the null occurs very slightly higher than 22.05kHz. The very steep rolloff ensures that any ultrasonic images of the full-scale 19.1kHz tone (blue trace) are completely eliminated, though distortion harmonics are evident, with the third the highest in level, at –67dB (0.045%).

Footnote 1: Following publication of the review, a reader alerted me to the fact that fig.3 indicated premature rolloff with the two lower sample rates. Other than the response at 384kHz, this graph was taken with S/PDIF data. USB data appeared to be handled correctly at 44.1kHz and 96kHz, so until I can take a second look at the review sample, I am not sure what had occurred when I prepared this graph.—John Atkinson
Fig.1 MSB Analog DAC, impulse response (4ms time window).
Fig.2 MSB Analog DAC, wideband spectrum of white noise at –4dBFS (left channel blue, right magenta) and 19.1kHz tone at 0dBFS (left cyan, right red), with data sampled at 44.1kHz (20dB/vertical div.).
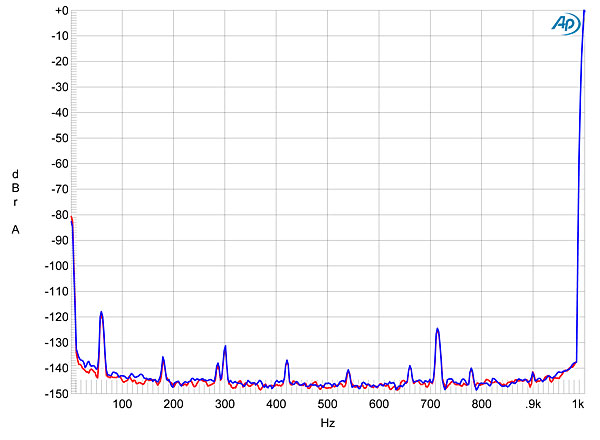
Fig.3 shows the Analog DAC's frequency response with data sampled at 44.1kHz (green and gray traces), 96kHz (cyan, magenta), 192kHz (blue, red), and 384kHz (green, blue). In each case, the audioband response is perfectly flat, with superb matching of channel levels, followed by a steep rolloff (footnote 1). Only with 384kHz data is there a very slight rise in response—just +0.2dB— before the filter cuts off the output. Channel separation (not shown) is superb, at >125dB in both directions below 1kHz. Spectral analysis of the Analog DAC's noise floor (fig.4) indicated that while a spurious tone was present at 60Hz—the DAC sat atop the Power Base for the measurements—this lay at –120dB (0.0001%) and will be irrelevant to sound quality. No spuriae were present at the full-wave–rectified power-supply frequency of 120Hz, indicating superb internal grounding and optimal circuit layout.
Fig.3 MSB Analog DAC, frequency response at –12dBFS into 100k ohms with data sampled at: 44.1kHz (left channel green, right gray), 96kHz (left cyan, right magenta), 192kHz (left blue, right red), 384kHz (left green, right blue) (1dB/vertical div.).
Fig.4 MSB Analog DAC, spectrum of 1kHz sinewave, DC–1kHz, at 0dBFS into 100k ohms (left channel blue, right red; linear frequency scale).
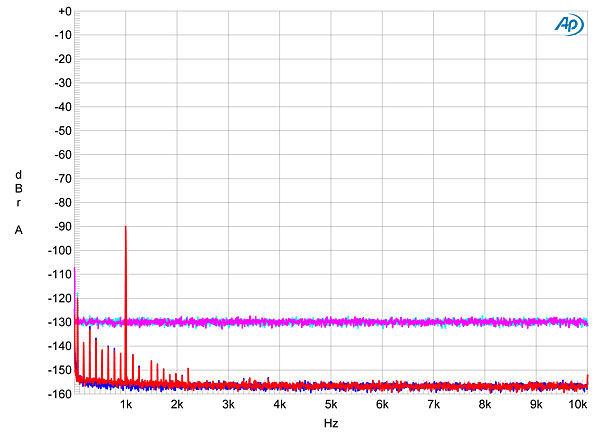
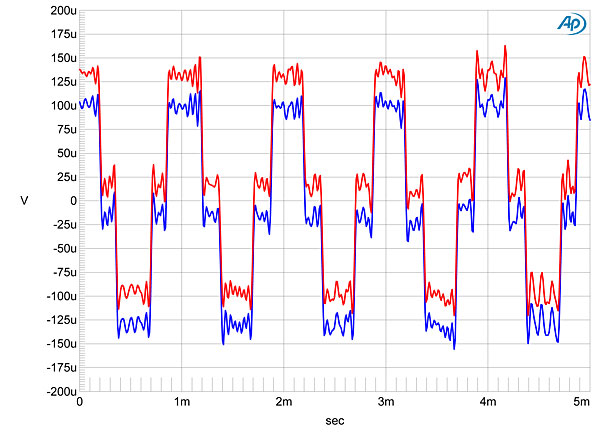
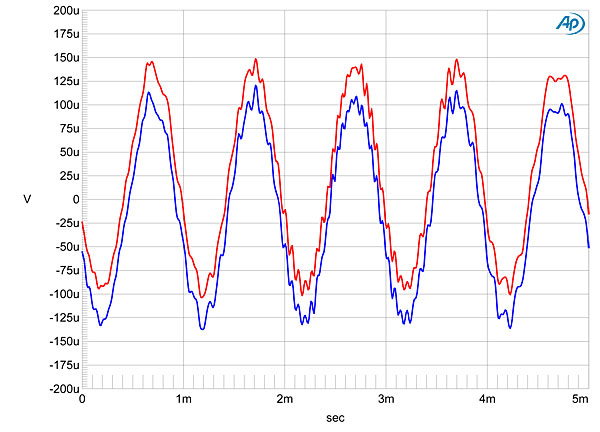
With dithered 16-bit data representing a 1kHz tone at –90dBFS (fig.5, cyan and magenta traces), the spectral spike peaks at exactly –90dBFS, suggesting minimal linearity error, and the noise floor shows only the contribution of the dither used to encode the signal. Increasing the bit depth to 24 (blue, red traces) drops the noise floor by 28dB, suggesting DAC resolution of almost 21 bits, which is state of the 2014 art. No distortion harmonics are unmasked by the drop in noise, and while some spuriae at 60Hz and its harmonics can be seen, these all lie at or well below –130dBFS. Fig.5 was taken with TosLink data; repeating the analysis with USB data gave identical results, confirming that the Analog DAC correctly handles 24-bit data via USB. With undithered 16-bit data, a sinewave at exactly –90.31dBFS was reproduced with perfect waveform symmetry and with the three DC voltage levels described by the data clearly evident (fig.6). With 24-bit data (fig.7) the result was a good sinewave, despite the very low signal level.
Fig.5 MSB Analog DAC, spectrum with noise and spuriae of dithered 1kHz tone at –90dBFS with: 16-bit data (left channel cyan, right magenta), 24-bit data (left blue, right red) (20dB/vertical div.).
Fig.6 MSB Analog DAC, waveform of undithered 1kHz sinewave at –90.31dBFS, 16-bit data (left channel blue, right red).
Fig.7 MSB Analog DAC, waveform of undithered 1kHz sinewave at –90.31dBFS, 24-bit data (left channel blue, right red).
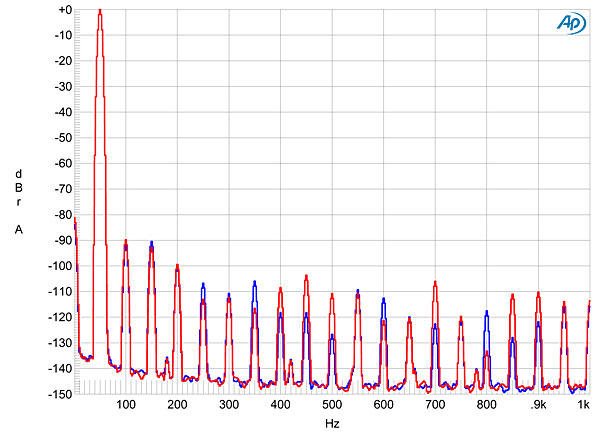
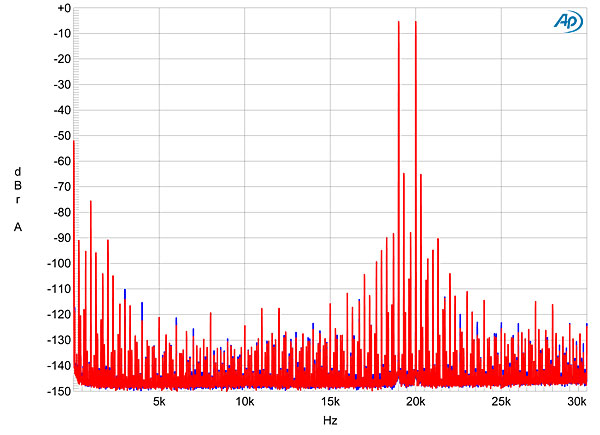
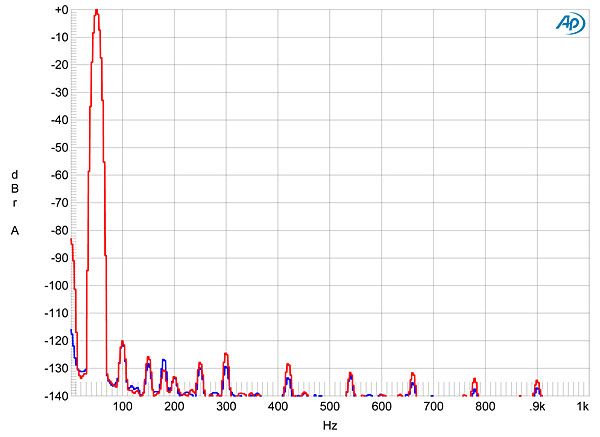
Fig.2 suggested that high-level signals produced some low-level distortion harmonics, which I confirmed by looking at the spectrum of a full-scale, 24-bit 50Hz tone (fig.8). The second and third harmonics are the highest in level, though these lie at –90dB (0.003%), and a picket fence of higher-order harmonics is also evident, though at lower levels. This graph was taken into the punishing 600 ohm load; the picture didn't change with the more benign 100k ohm load, nor did it change with frequency. Fed 24-bit data representing an equal mix of 19 and 20kHz tones, the Analog DAC produced a rather messy-looking spectrum (fig.9). Though intermodulation distortion products are relatively low in level, there are some odd-looking enharmonic products.
Fig.8 MSB Analog DAC, spectrum of 50Hz sinewave, DC–1kHz, at 0dBFS into 600 ohms (left channel blue, right red; linear frequency scale).
Fig.9 MSB Analog DAC, HF intermodulation spectrum, DC–30kHz, 19+20kHz at 0dBFS into 600 ohms (left channel blue, right red; linear frequency scale).
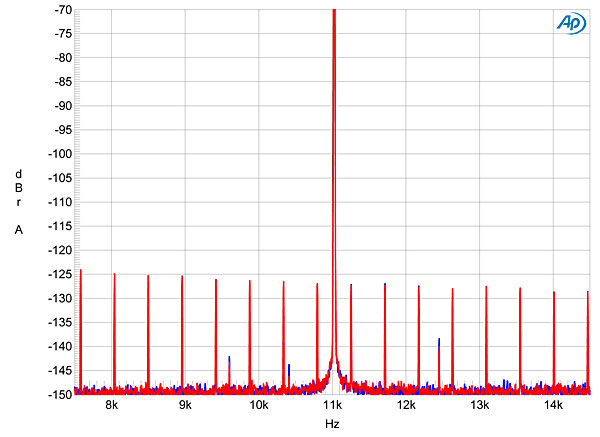
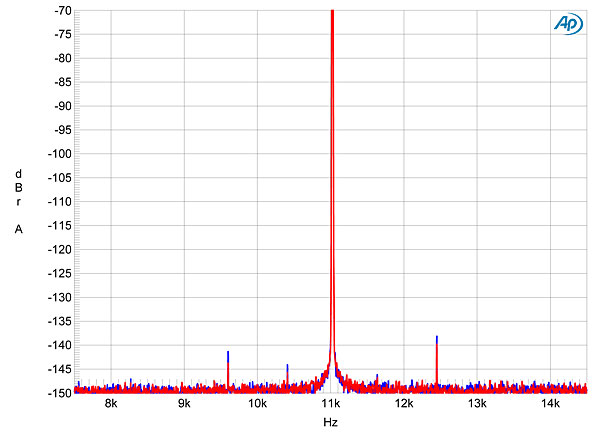
With the MSB fed a 16-bit version of the Miller-Dunn J-Test signal via TosLink, spectral analysis of the Analog DAC's output (fig.10) revealed no accentuation of the odd-order harmonics of the LSB-level, low-frequency squarewave; almost no spectral spreading of the central spike that represents the high-level tone at one-quarter the sample rate; and just a single pair of sidebands, at ±1425Hz, these at a roots-of-the-universe level of –142dB and of unknown origin. This is textbook behavior. Increasing the J-Test signal's bit depth to 24 gave the spectrum shown in fig.11. The very-low-level sidebands can still be seen, but the spectrum is otherwise superbly clean.
Fig.10 MSB Analog DAC, high-resolution jitter spectrum of analog output signal, 11.025kHz at –6dBFS, sampled at 44.1kHz with LSB toggled at 229Hz: 16-bit data via S/PDIF from AP SYS2722 (left channel blue, right red). Center frequency of trace, 11.025kHz; frequency range, ±3.5kHz.
Fig.11 MSB Analog DAC, high-resolution jitter spectrum of analog output signal, 11.025kHz at –6dBFS, sampled at 44.1kHz with LSB toggled at 229Hz: 24-bit data via S/PDIF from AP SYS2722 (left channel blue, right red). Center frequency of trace, 11.025kHz; frequency range, ±3.5kHz.
Turning to the optional analog input, this preserved absolute polarity and had a maximum gain of 9.12dB with the volume control set to "9," –0.013dB with it set to "0." The input impedance was 16.67k ohms at all audio frequencies and the frequency response was perfectly flat, up to 200kHz. The channel separation was as good as it was for digital data, at 125dB or better across the audioband. The analog input also featured extremely low distortion: with a 50Hz tone at 1V into 100k ohms, the second harmonic lay at just –120dB (0.0001%, fig.12), which is close to the residual level in the Audio Precision's signal generator. Intermodulation distortion (not shown) was equally low.
Fig.12 MSB Analog DAC, analog input, spectrum of 50Hz sinewave, DC–1kHz, at 1V into 100k ohms (left channel blue, right red; linear frequency scale).
It was a pleasure to measure such a good-performing product as MSB's Analog DAC. And I loved the top-mounted volume control, the display, and the ergonomics. It is rare to encounter an audio component so well thought out and so well engineered.—John Atkinson
Footnote 1: Following publication of the review, a reader alerted me to the fact that fig.3 indicated premature rolloff with the two lower sample rates. Other than the response at 384kHz, this graph was taken with S/PDIF data. USB data appeared to be handled correctly at 44.1kHz and 96kHz, so until I can take a second look at the review sample, I am not sure what had occurred when I prepared this graph.—John Atkinson


